
Tm Visualization Suite: Comparison Charts
How do values differ across categories, between two points, or across stages?
 View full size
Version 2.1.6 · released 2026-11-03
Compare categories, ranges and ranks in one view, and see who moved and by how much.
What it does
Tm Visualization Suite: Comparison Charts puts six ways to compare on one Qlik sheet object: dumbbell, dot plot, lollipop, range plot, slopegraph and bump chart. Each shows differences that a bar chart hides, such as the change between two years for every store or the rank of each department over time.
Click a mark to select the category behind it, and the rest of the sheet follows. The charts read your data and never change it. Very long category lists show the first part, with a note on how many are shown.
Analysts and BI leads who compare categories, periods or stages for a business review.
Good for
- Which stores grew most between two years?
- How wide is the spread of lead times by region?
- Which departments climbed or fell in rank?
Key features
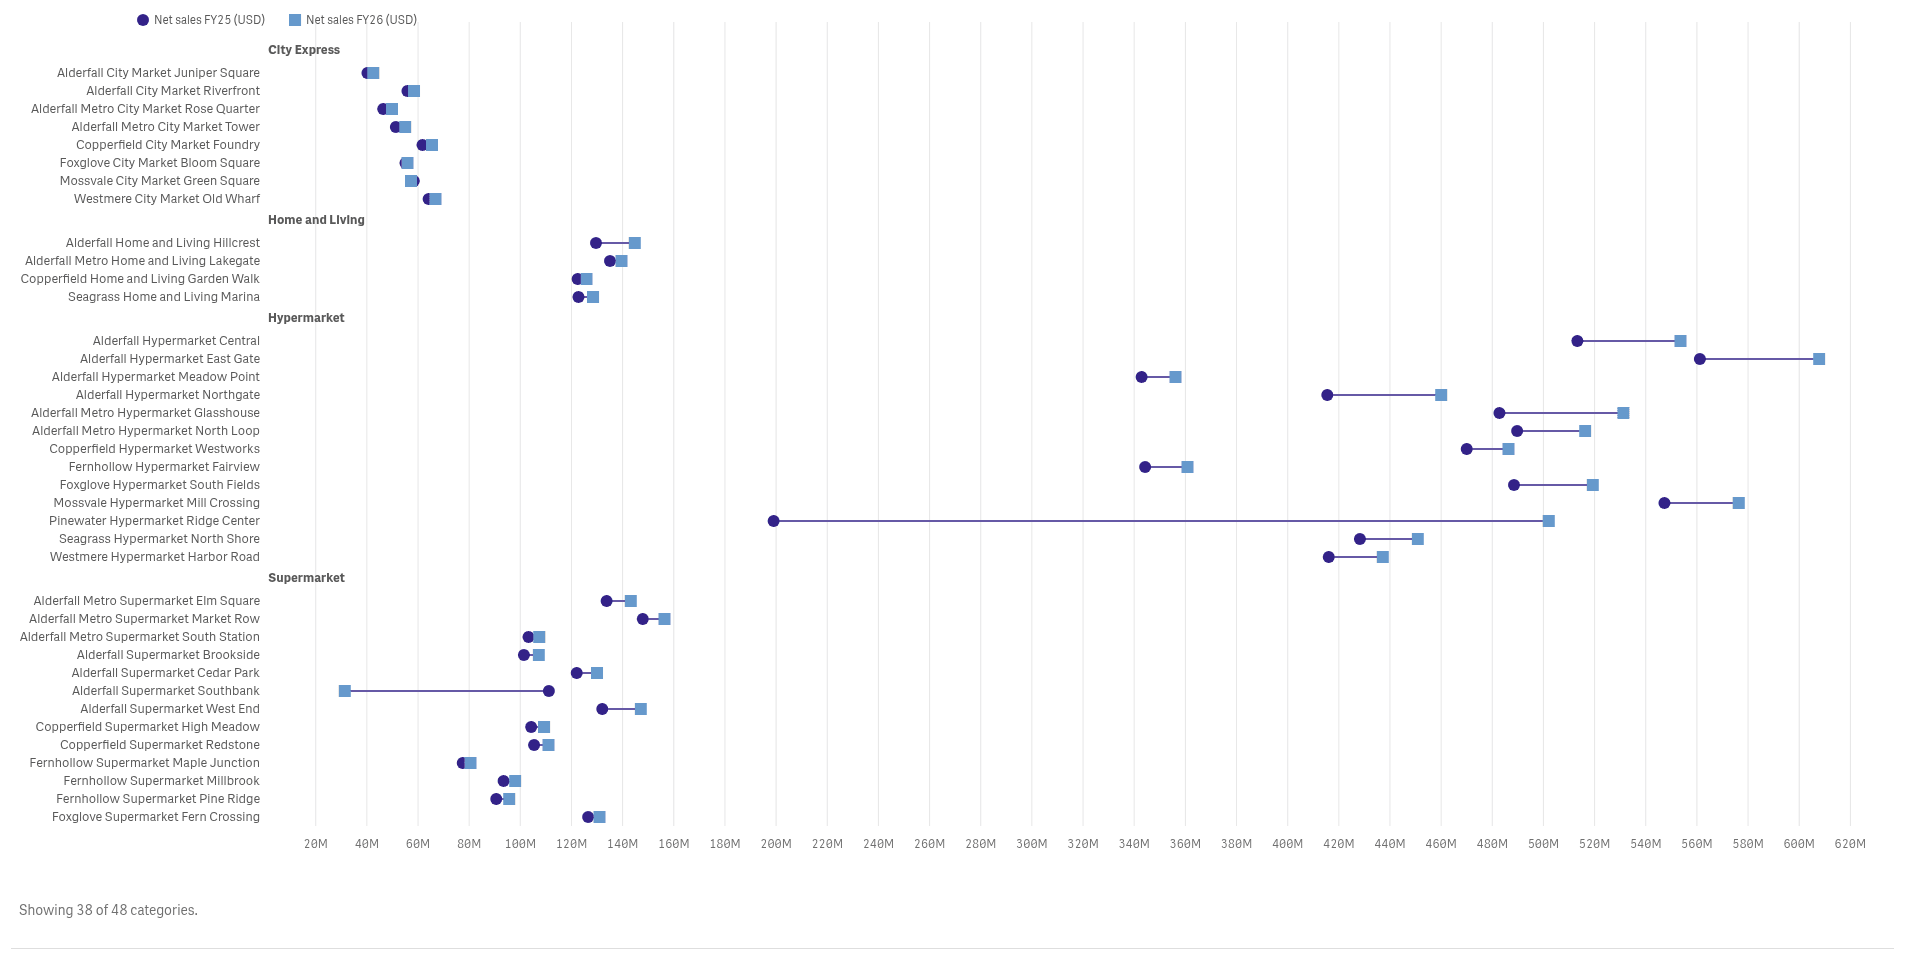
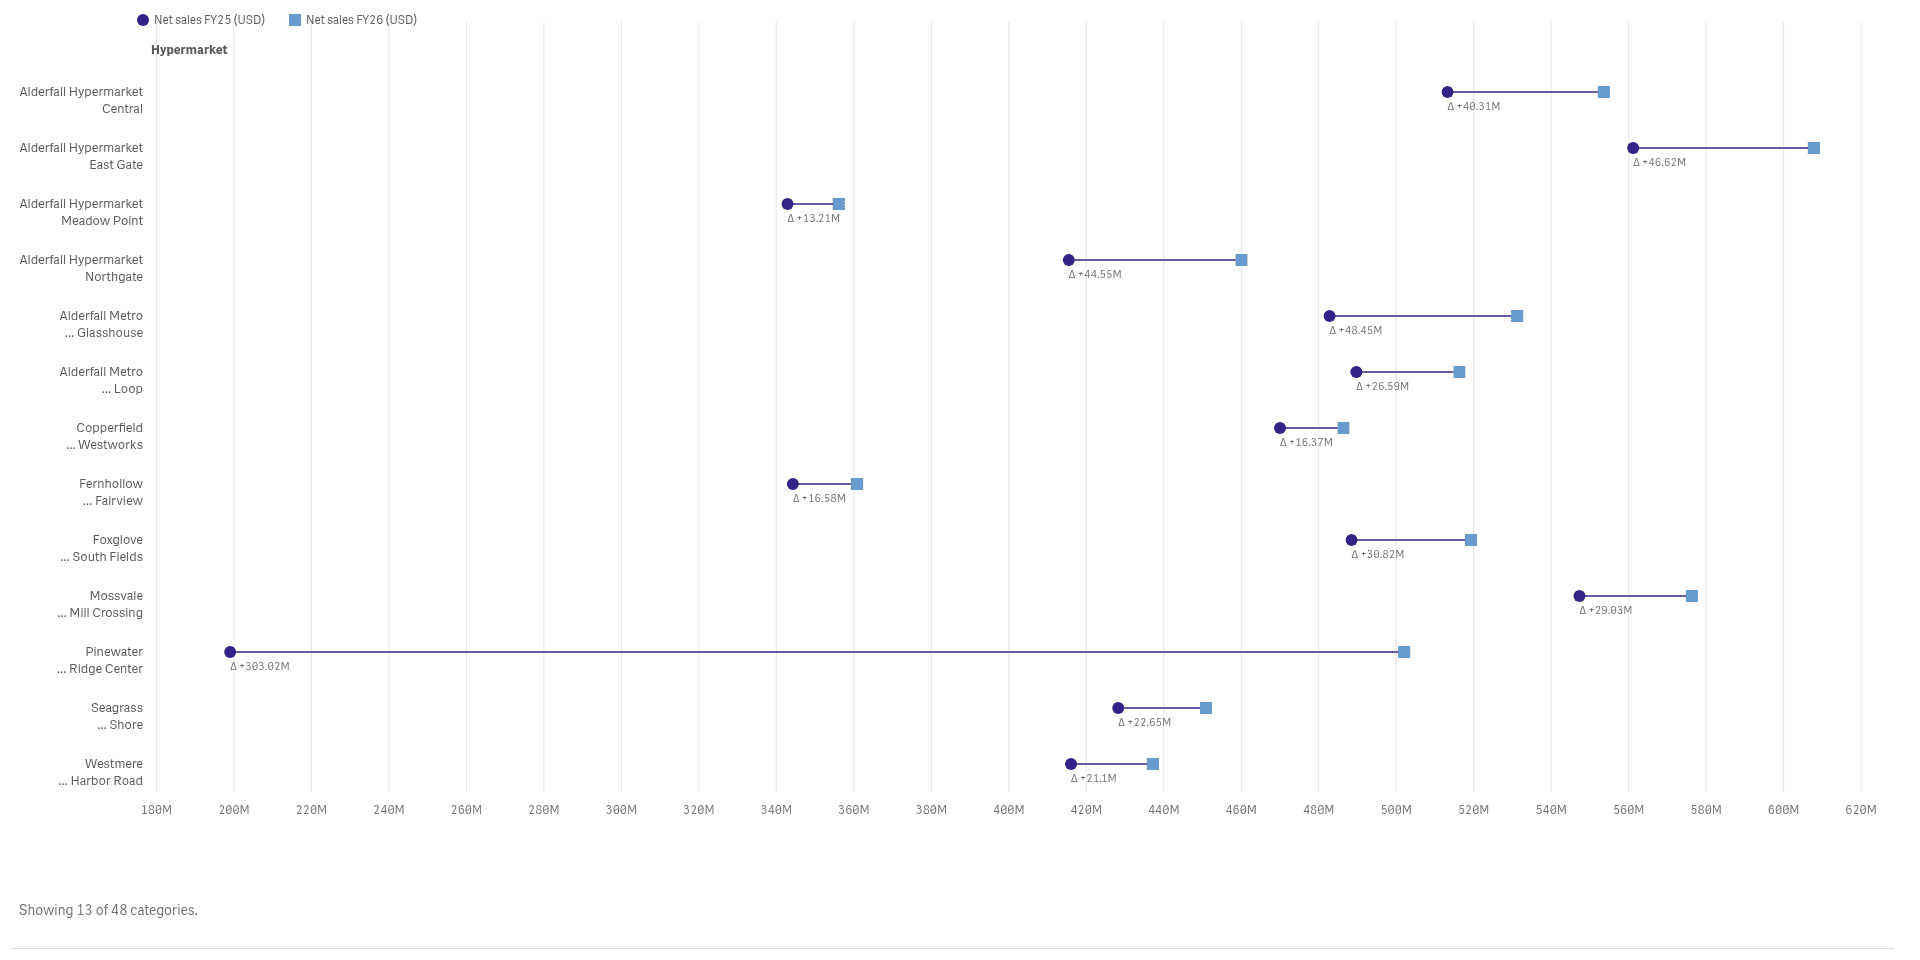
See the change between two points
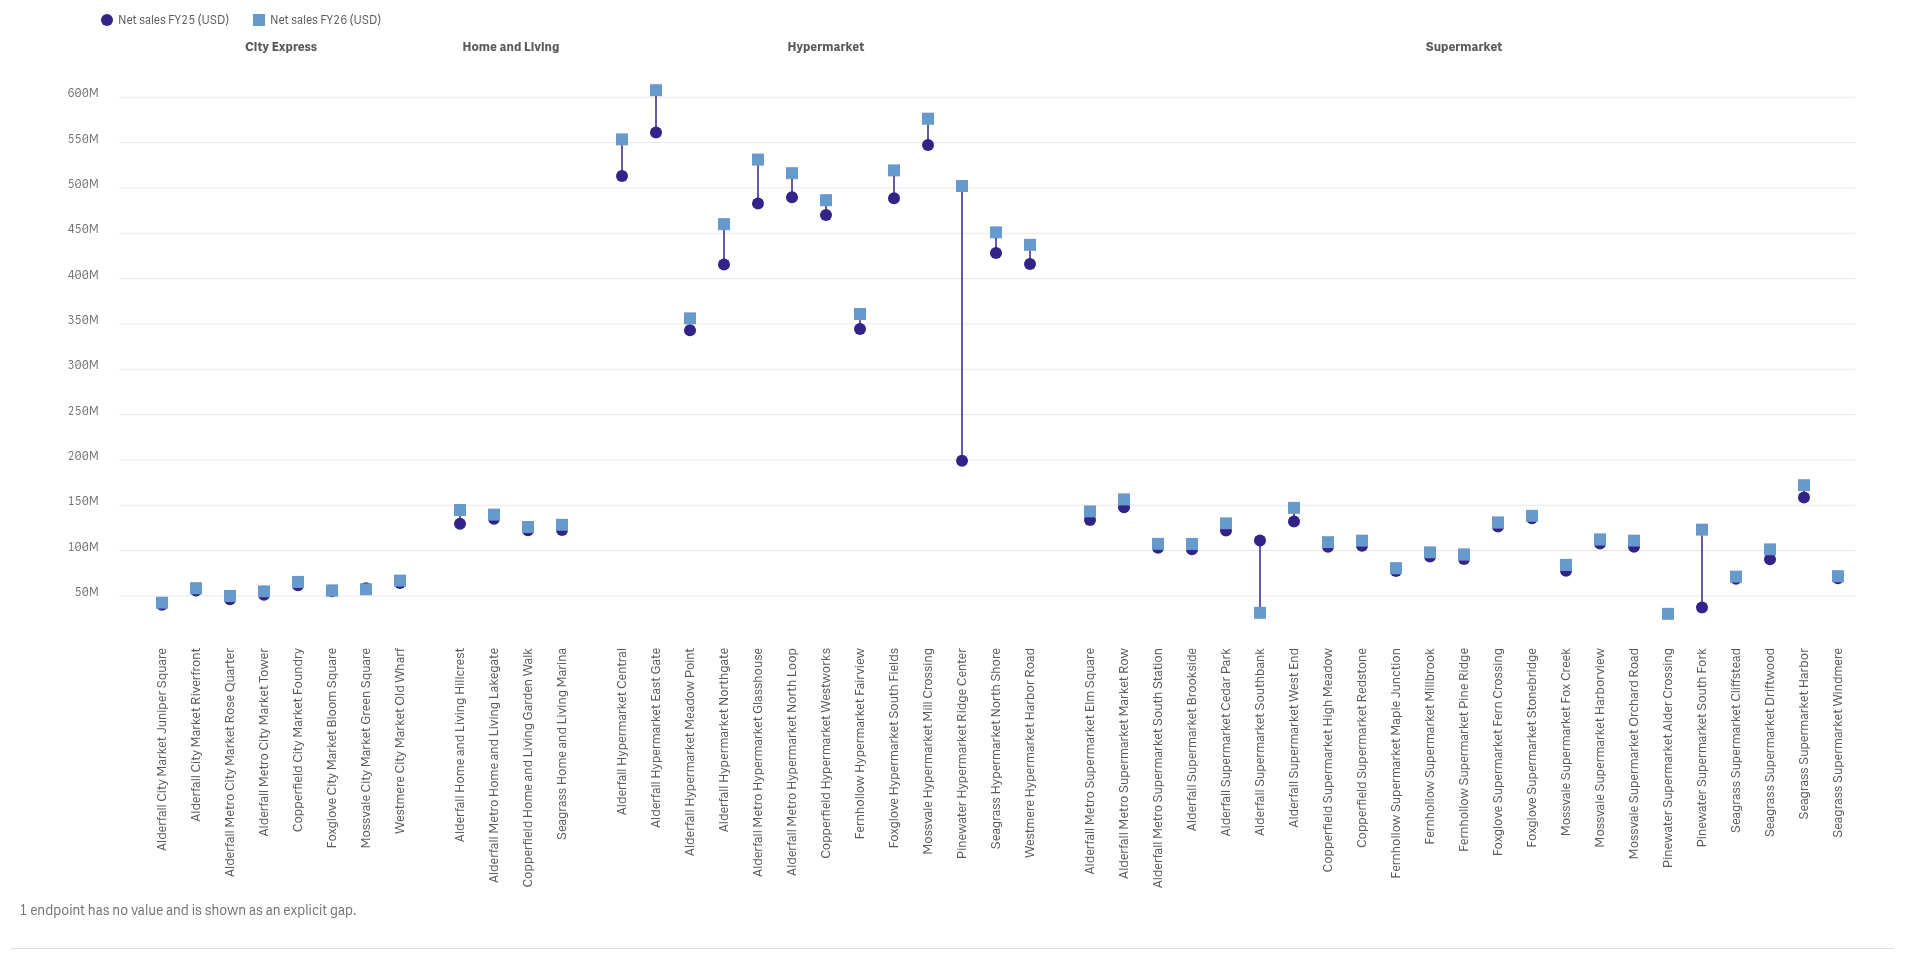
A dumbbell joins the two values of each category, so a long line means a big change.
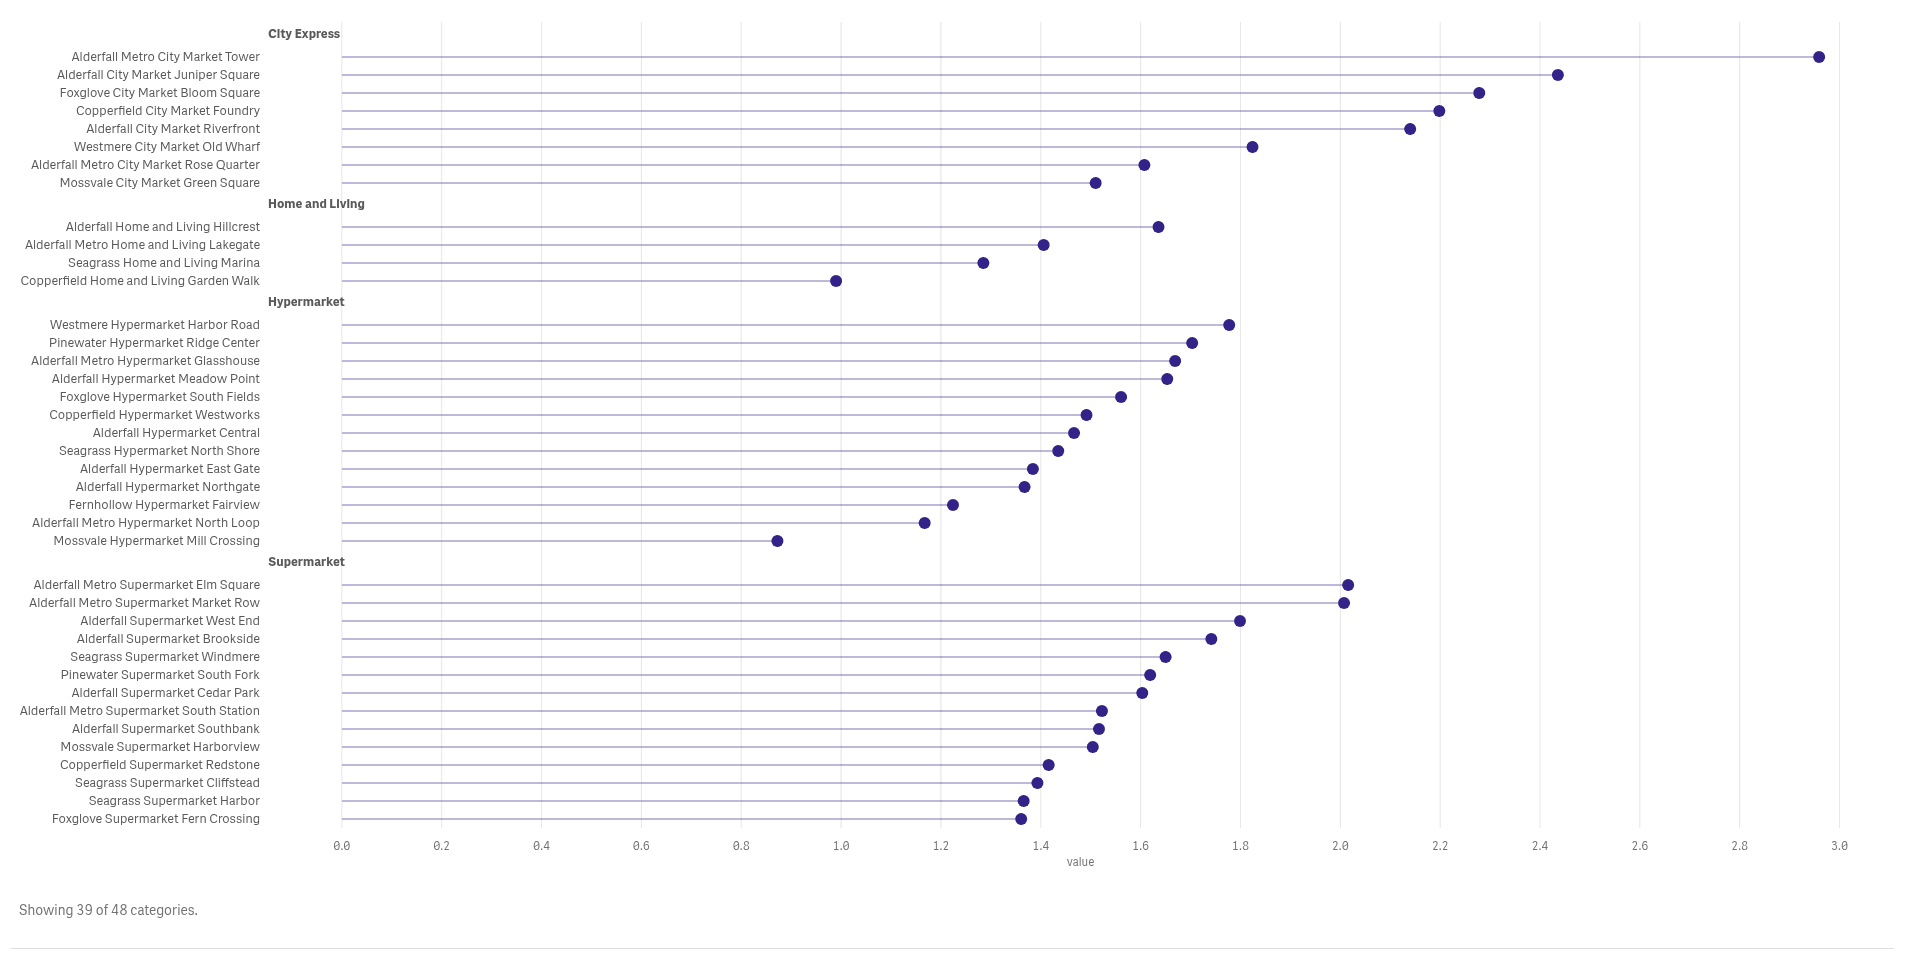
Rank many categories on one scale
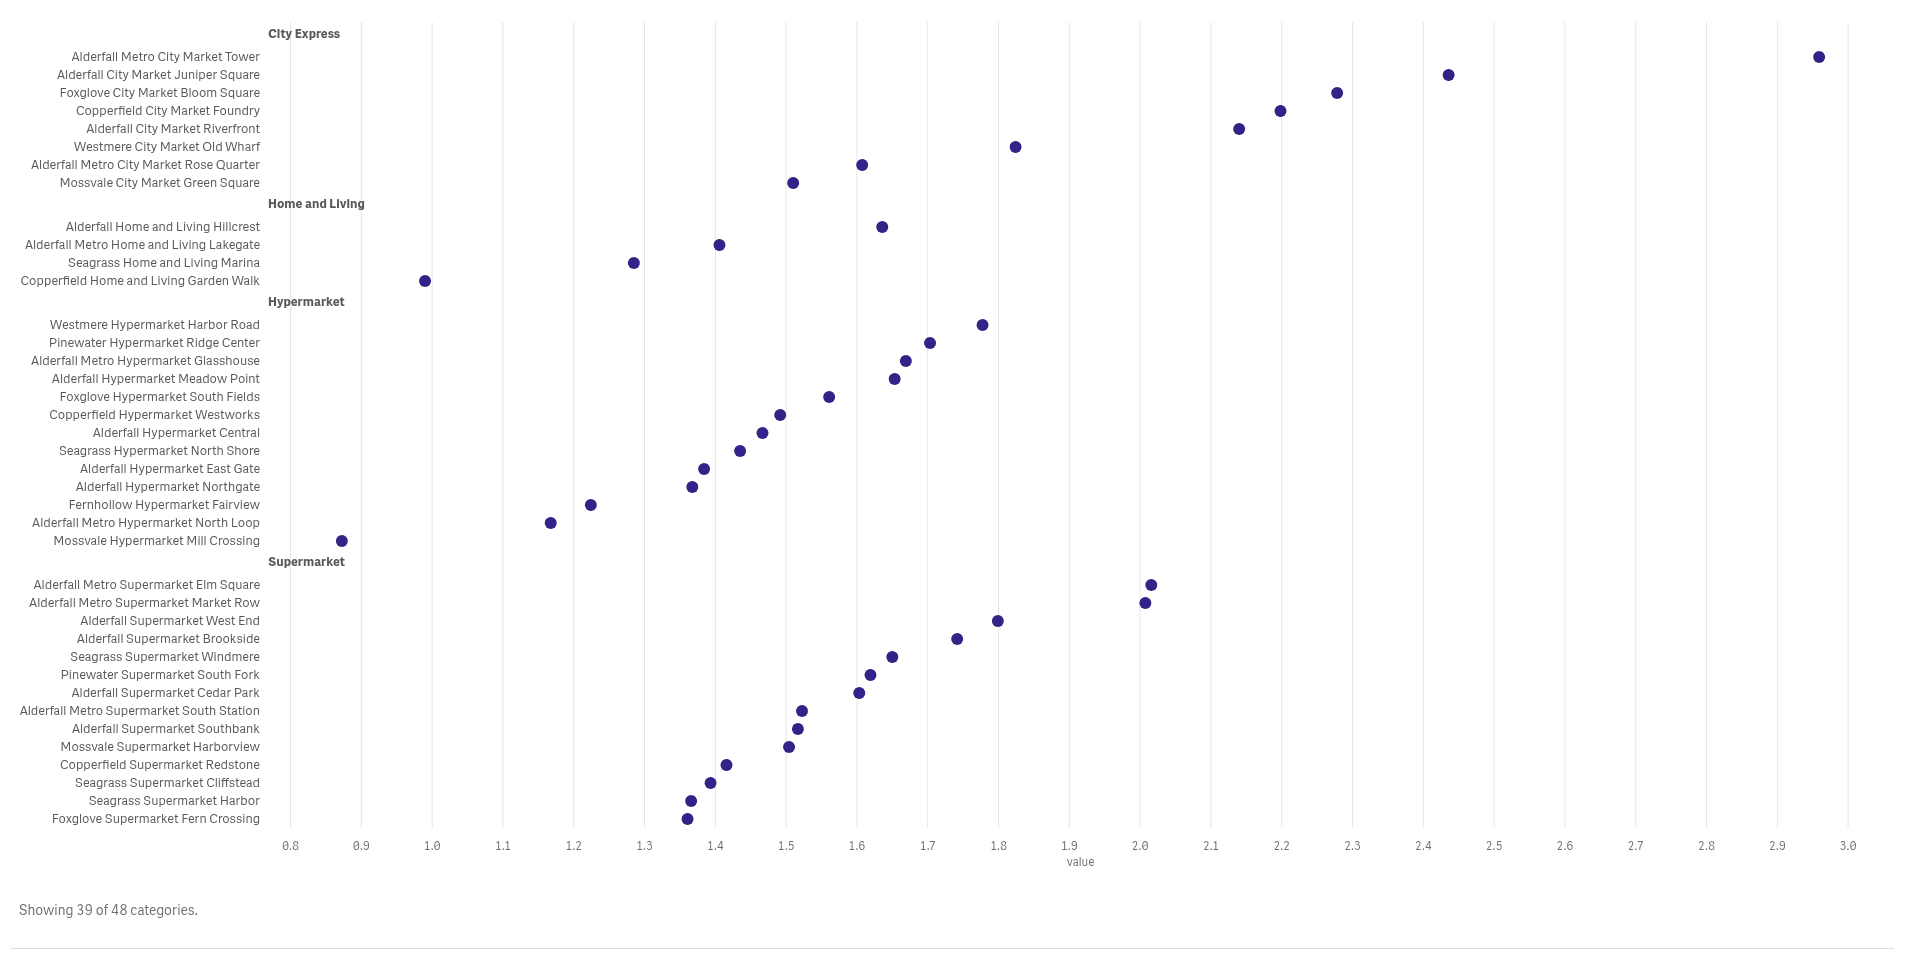
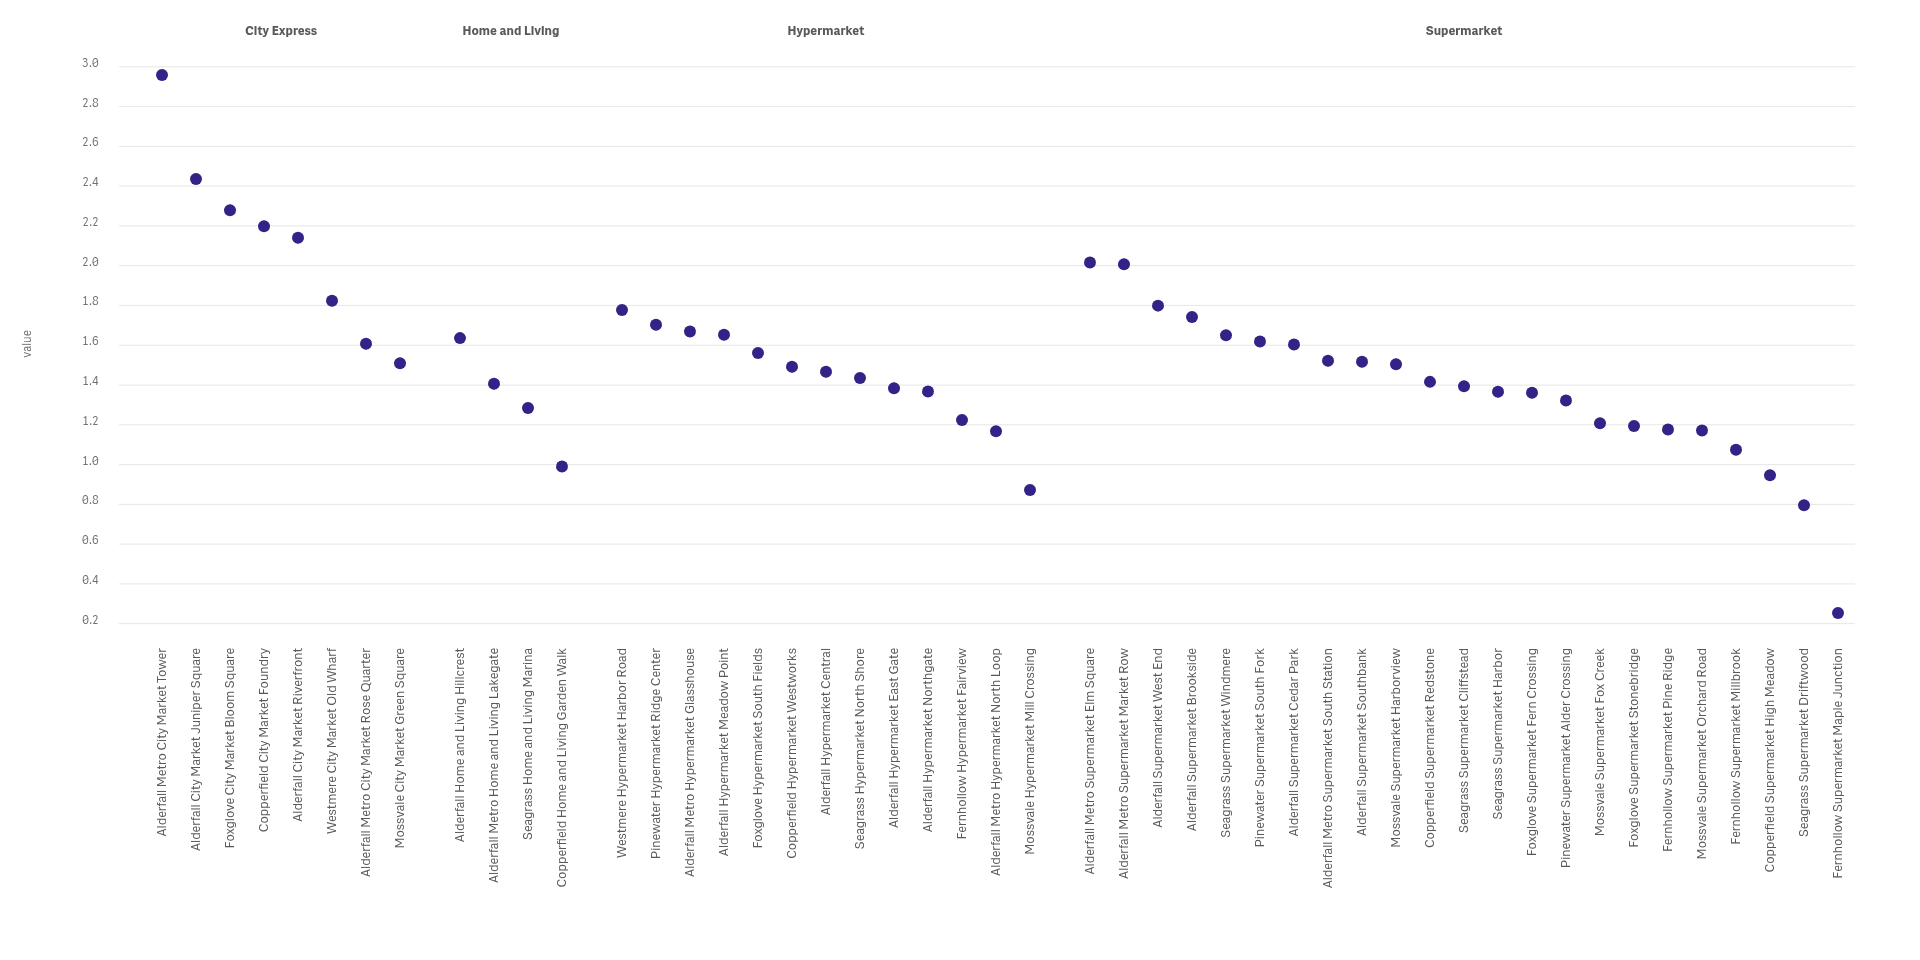
A dot plot sorts every category on one axis, so the highest and lowest stand out at once.
Draw a stem to the baseline
Add a stem from each dot to the baseline for a lollipop that reads like a lighter bar chart.
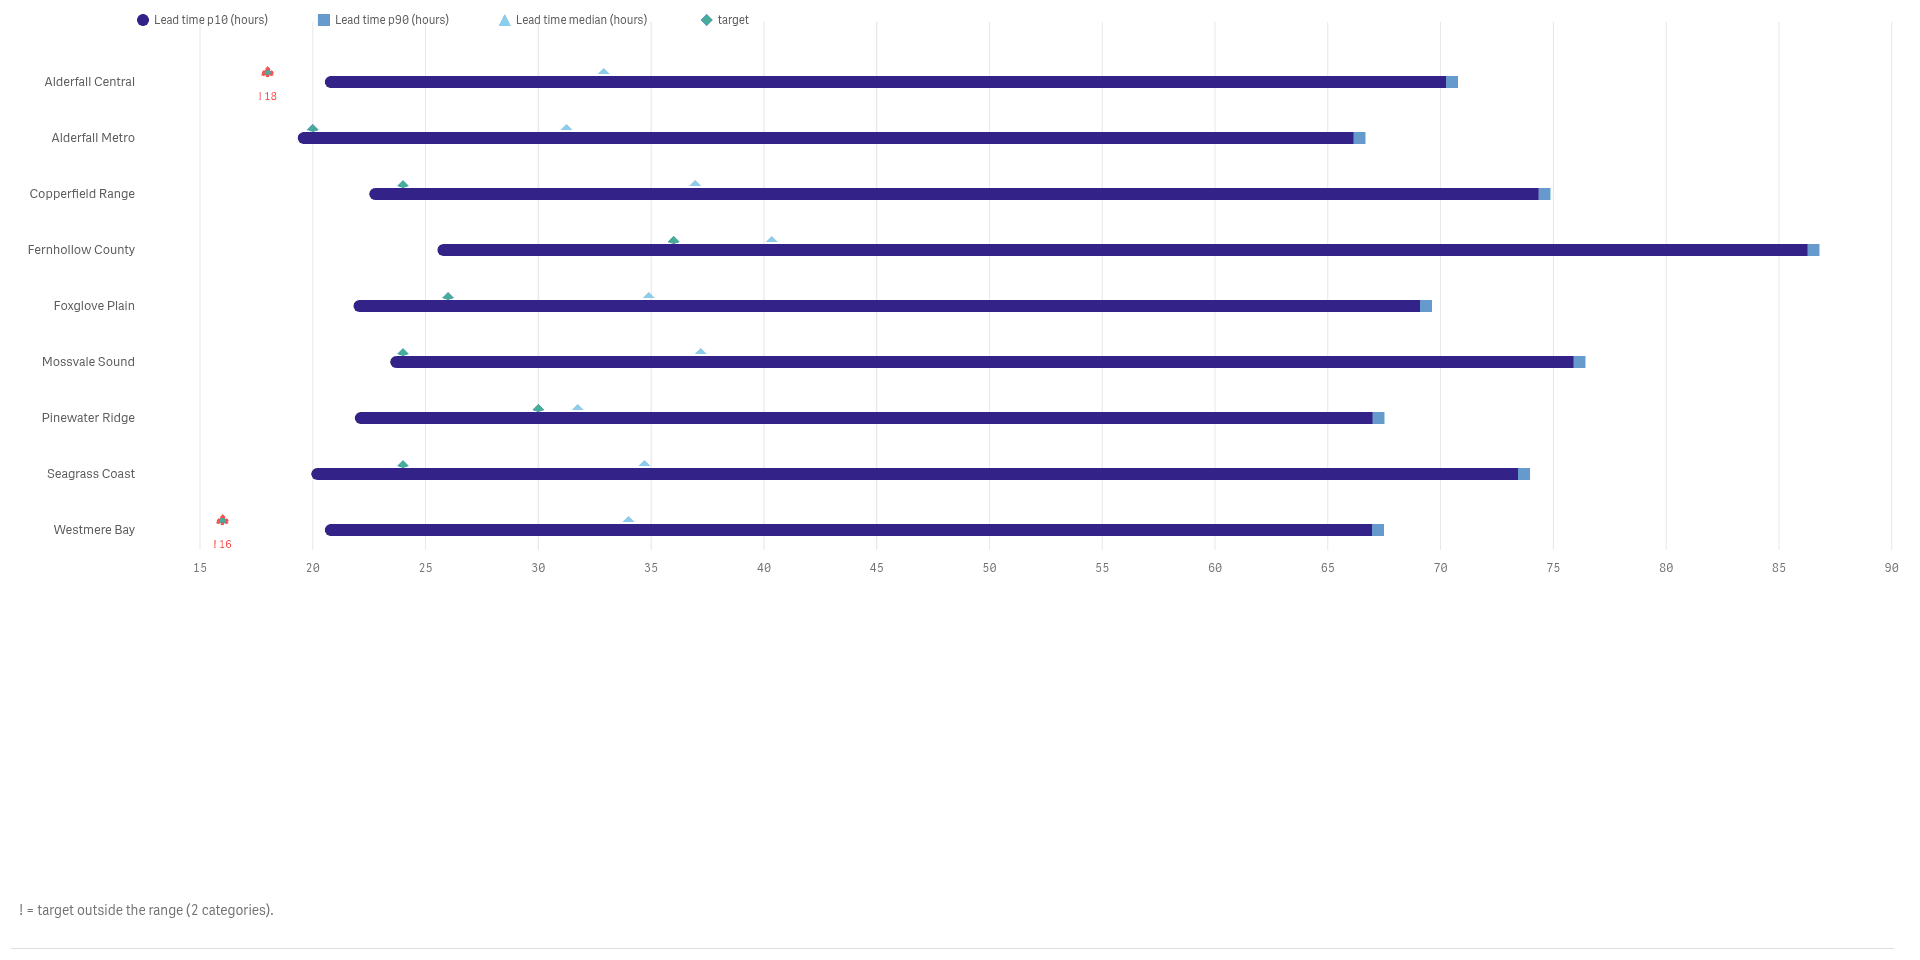
Show the range, and where you are in it
A range plot draws minimum to maximum with the actual value and the target marked on top.
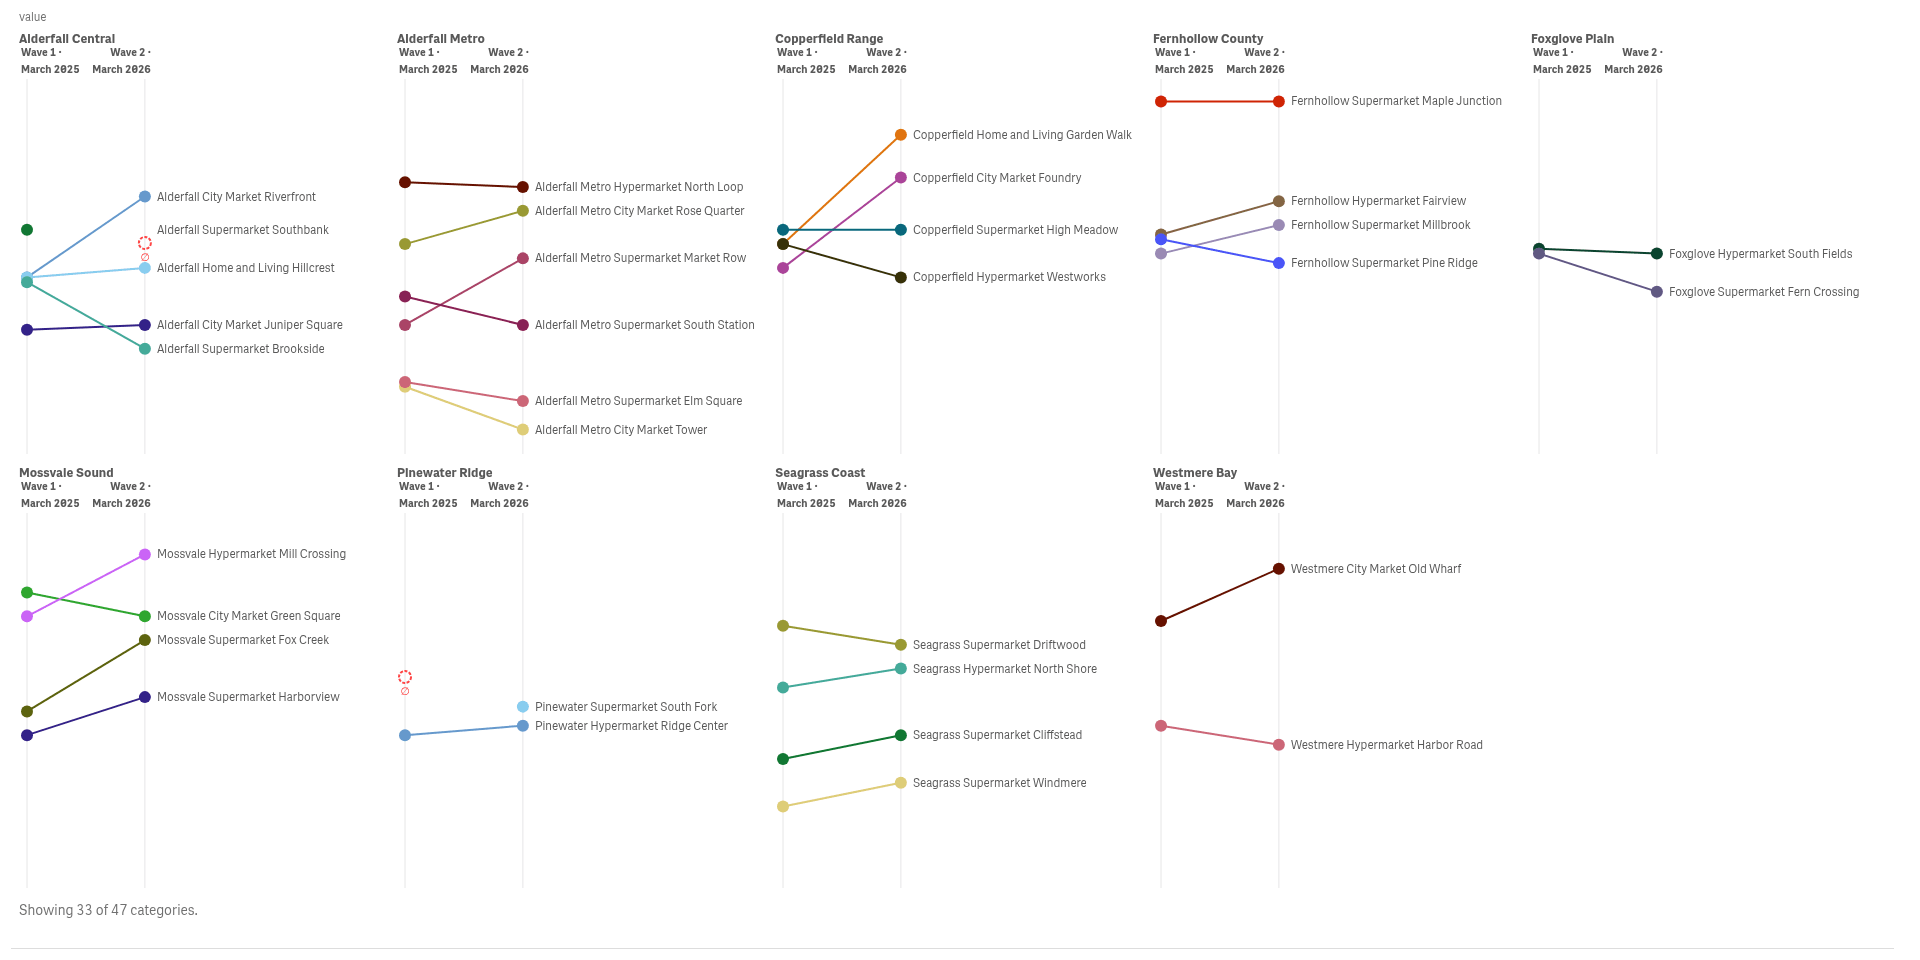
Compare two stages side by side
A slopegraph connects each category between two stages, so risers and fallers show as lines.
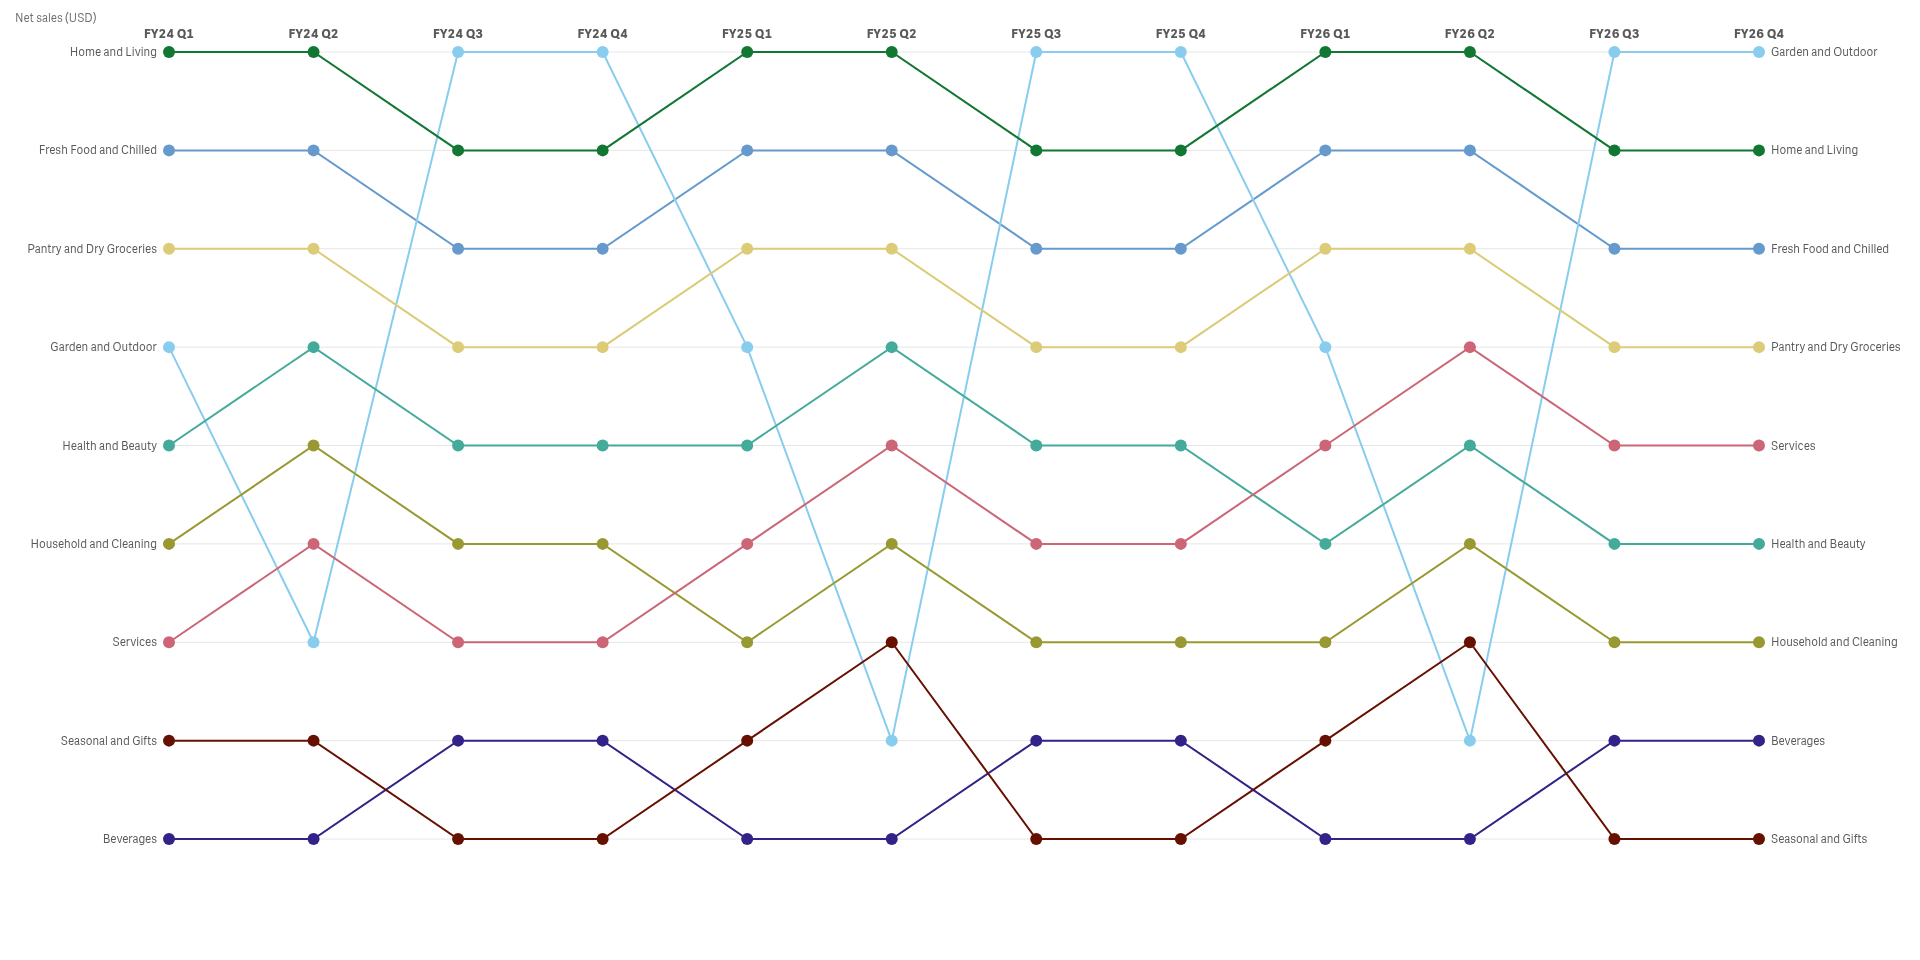
Follow rank across many stages
A bump chart tracks the rank of each category over time, so you see who overtakes whom.
See it working
 View full size
 View full size
Try it
Download
Version 2.1.6
Extension
Demo App
Release page on GitHub with every file and its checksum.
Install
Install an extension in Qlik Cloud or client-managed Qlik Sense.
Set up
Install notes
No install notes for this Product. See the general install page.
Docs
Release notes
No release notes yet.
How to get a license
- Review the Product Listing and its documentation.
- E-mail us the Product name, the name of your Qlik Cloud tenant and the number of users.
- We reply to you with the next step.