
Tm Visualization Suite: Hierarchy Explorer
How is the whole built from its parts, level by level?
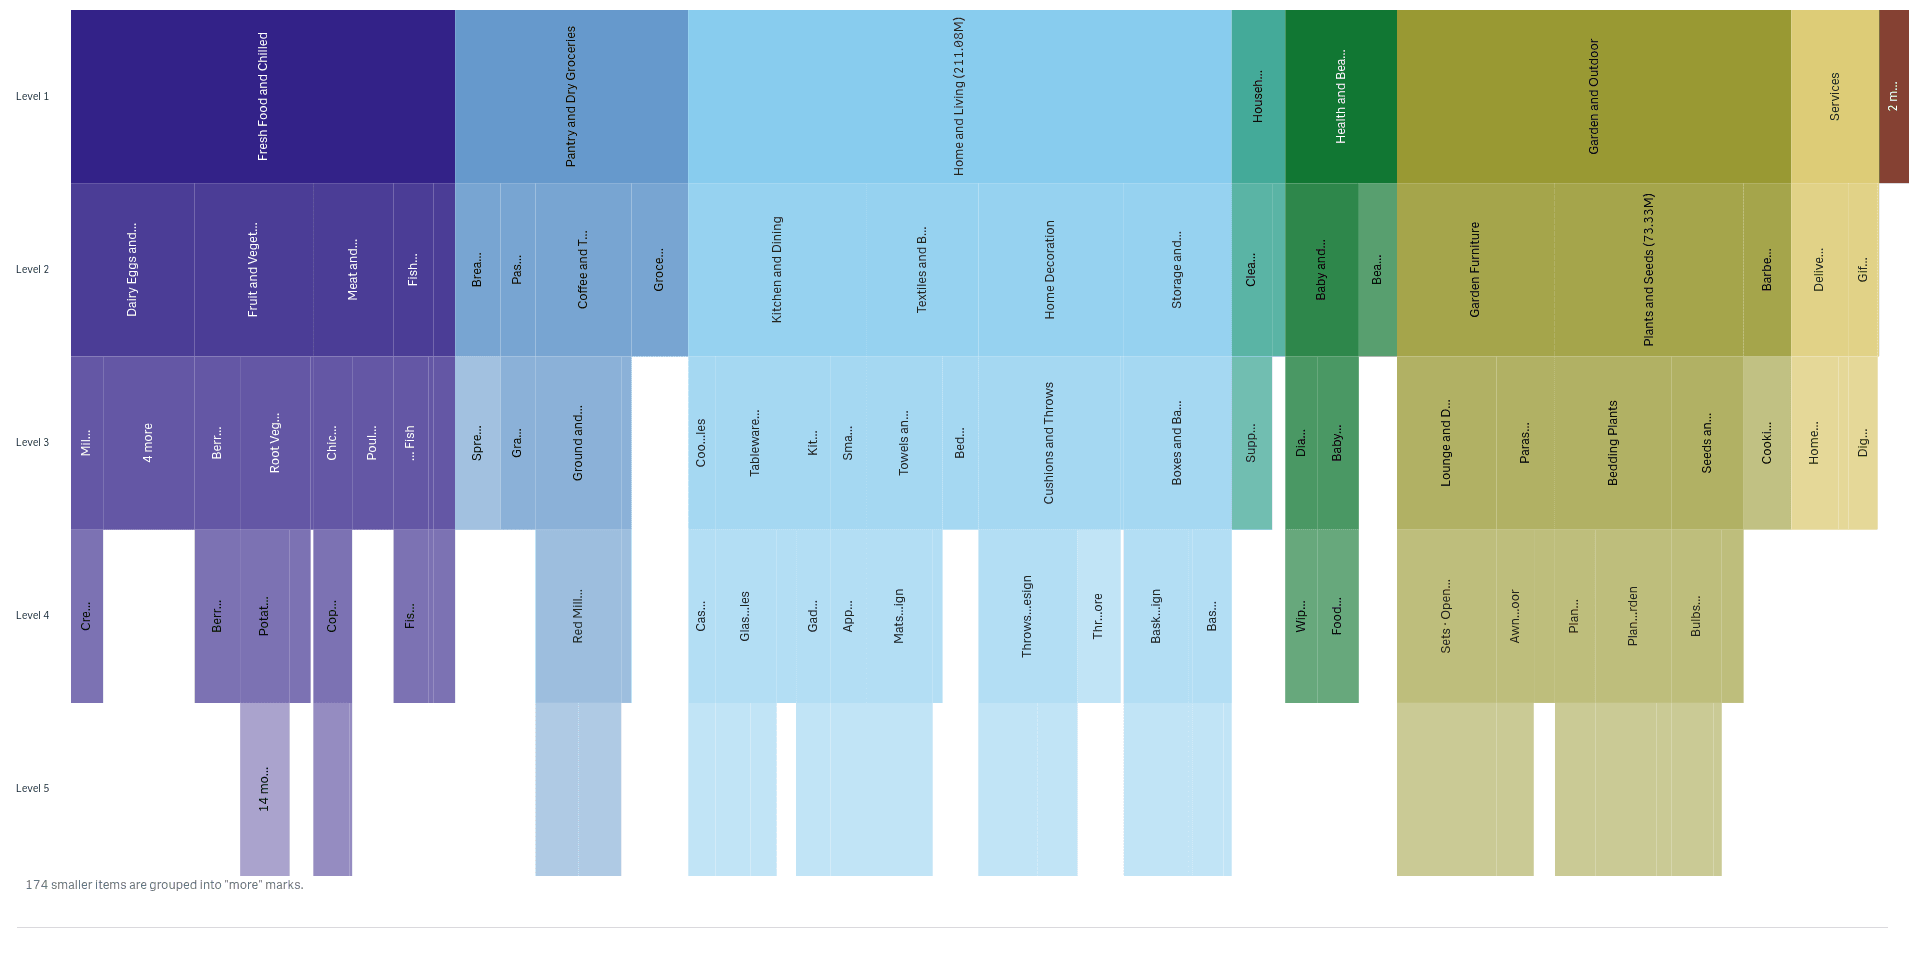 View full size
Version 2.1.6 · released 2026-11-03
See how a total splits into categories and sub-categories, and which branches carry the weight.
What it does
Tm Visualization Suite: Hierarchy Explorer shows how a total splits into categories and sub-categories on one Qlik sheet object. Pick the shape that fits the question: rings, stacked columns or rows, nested circles, or a branching tree. Size and colour show where the weight sits and which branch it belongs to.
Click a branch to select the items behind it, and the rest of the sheet follows. The charts read your data and never change it. Branches with very many small items are grouped into a "more" mark, with a note saying how many.
Analysts and BI leads who explain a total through its categories and sub-categories.
Good for
- Which product groups make up most of our sales?
- Where does one category split into many small items?
- How do departments, groups and items nest?
Key features
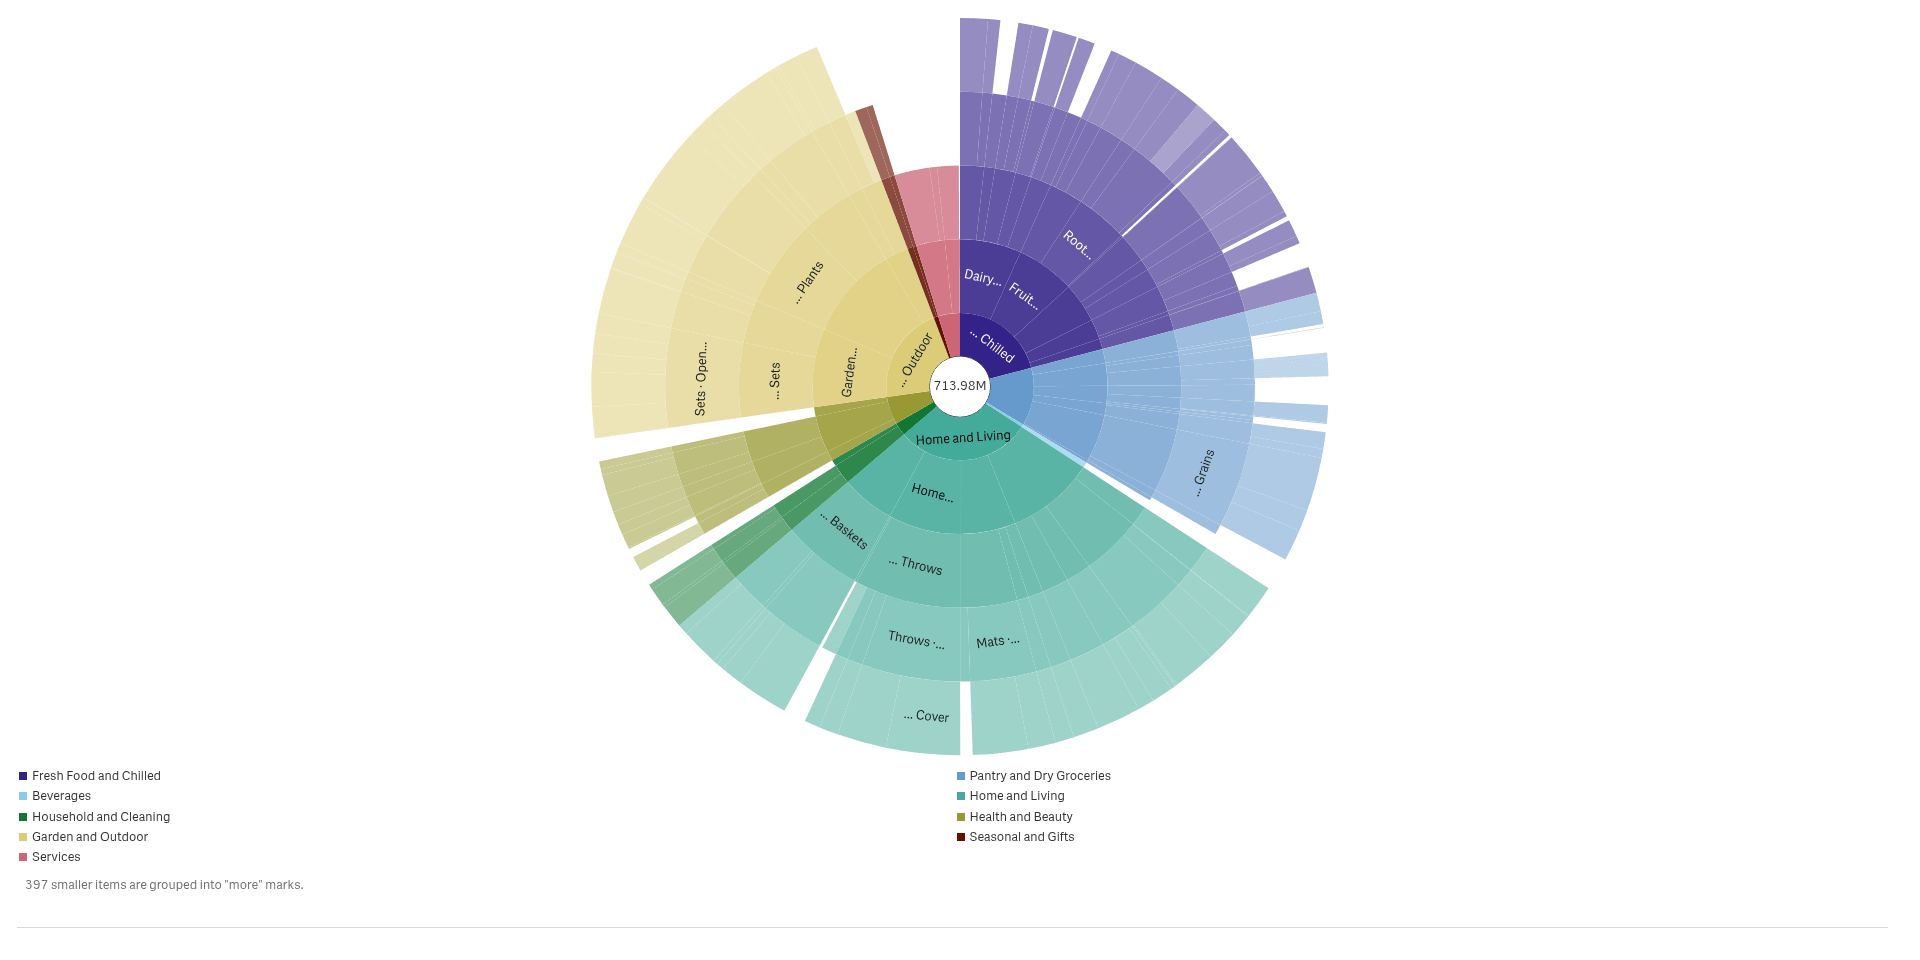
Read a total as rings
A sunburst puts the top level in the centre and each deeper level in the next ring, sized by value.
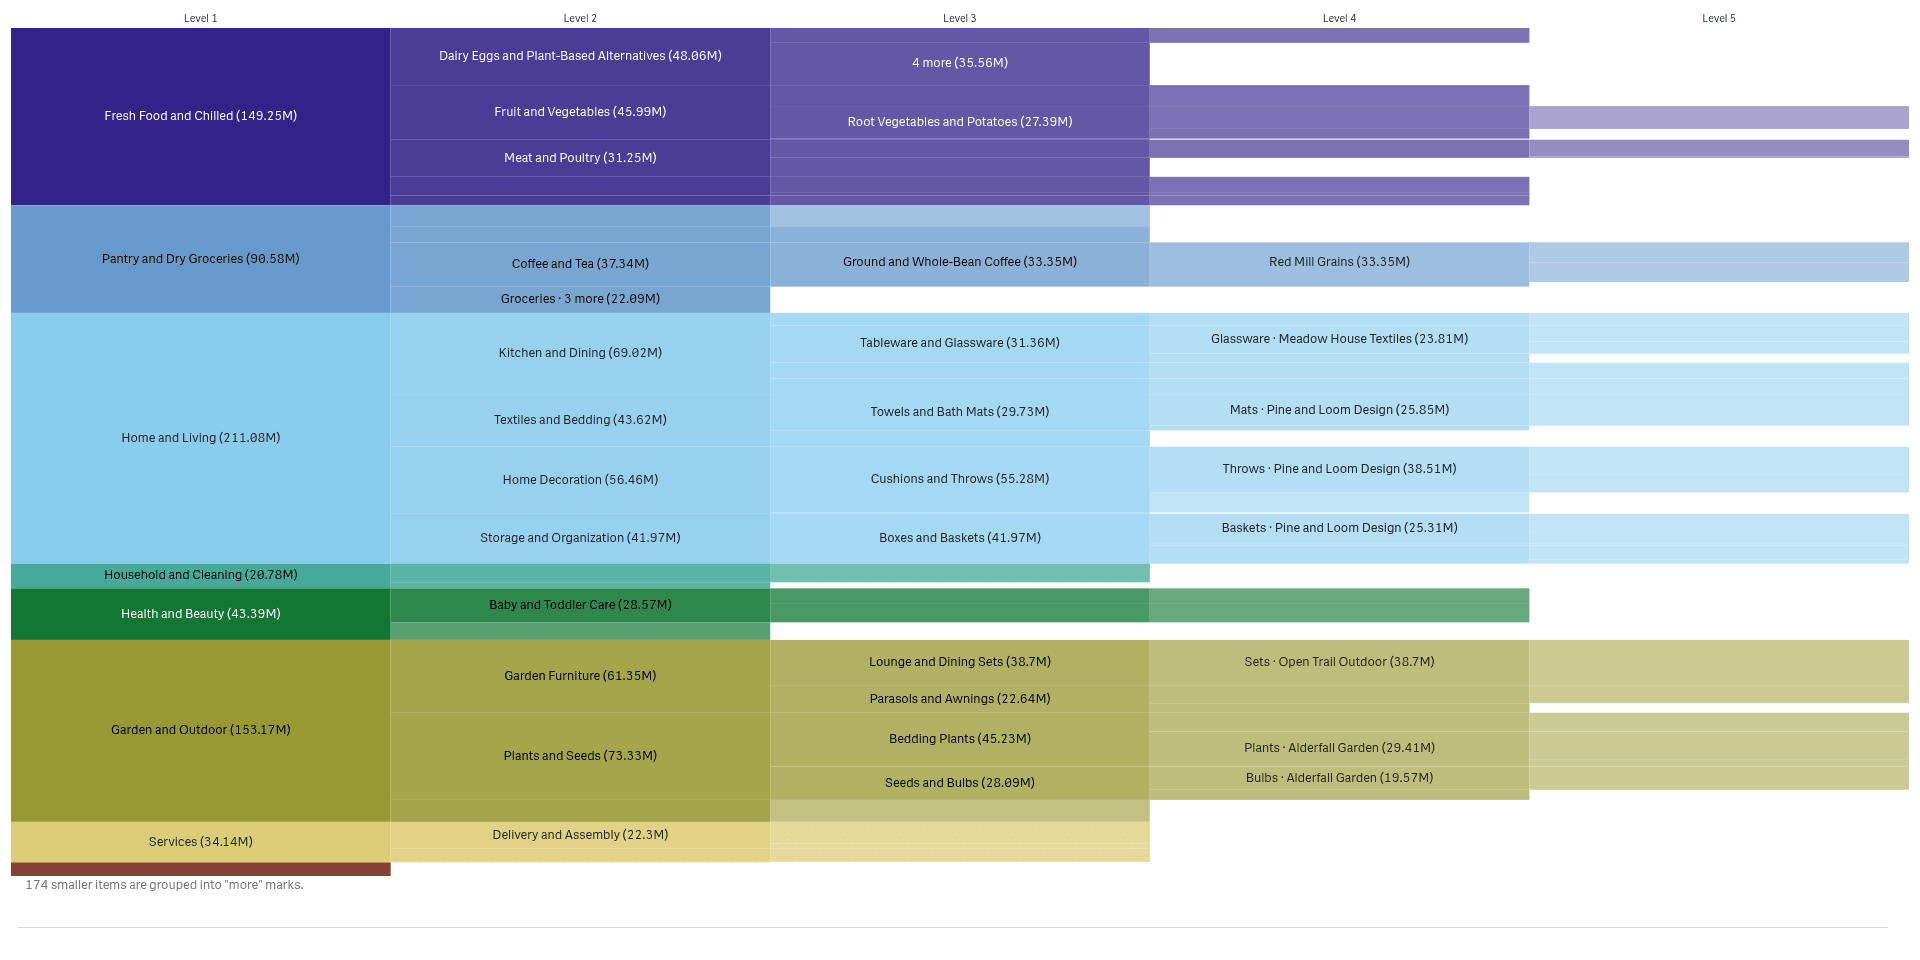
Compare levels side by side
An icicle lines the levels up as columns, so you can compare branch sizes across each level.
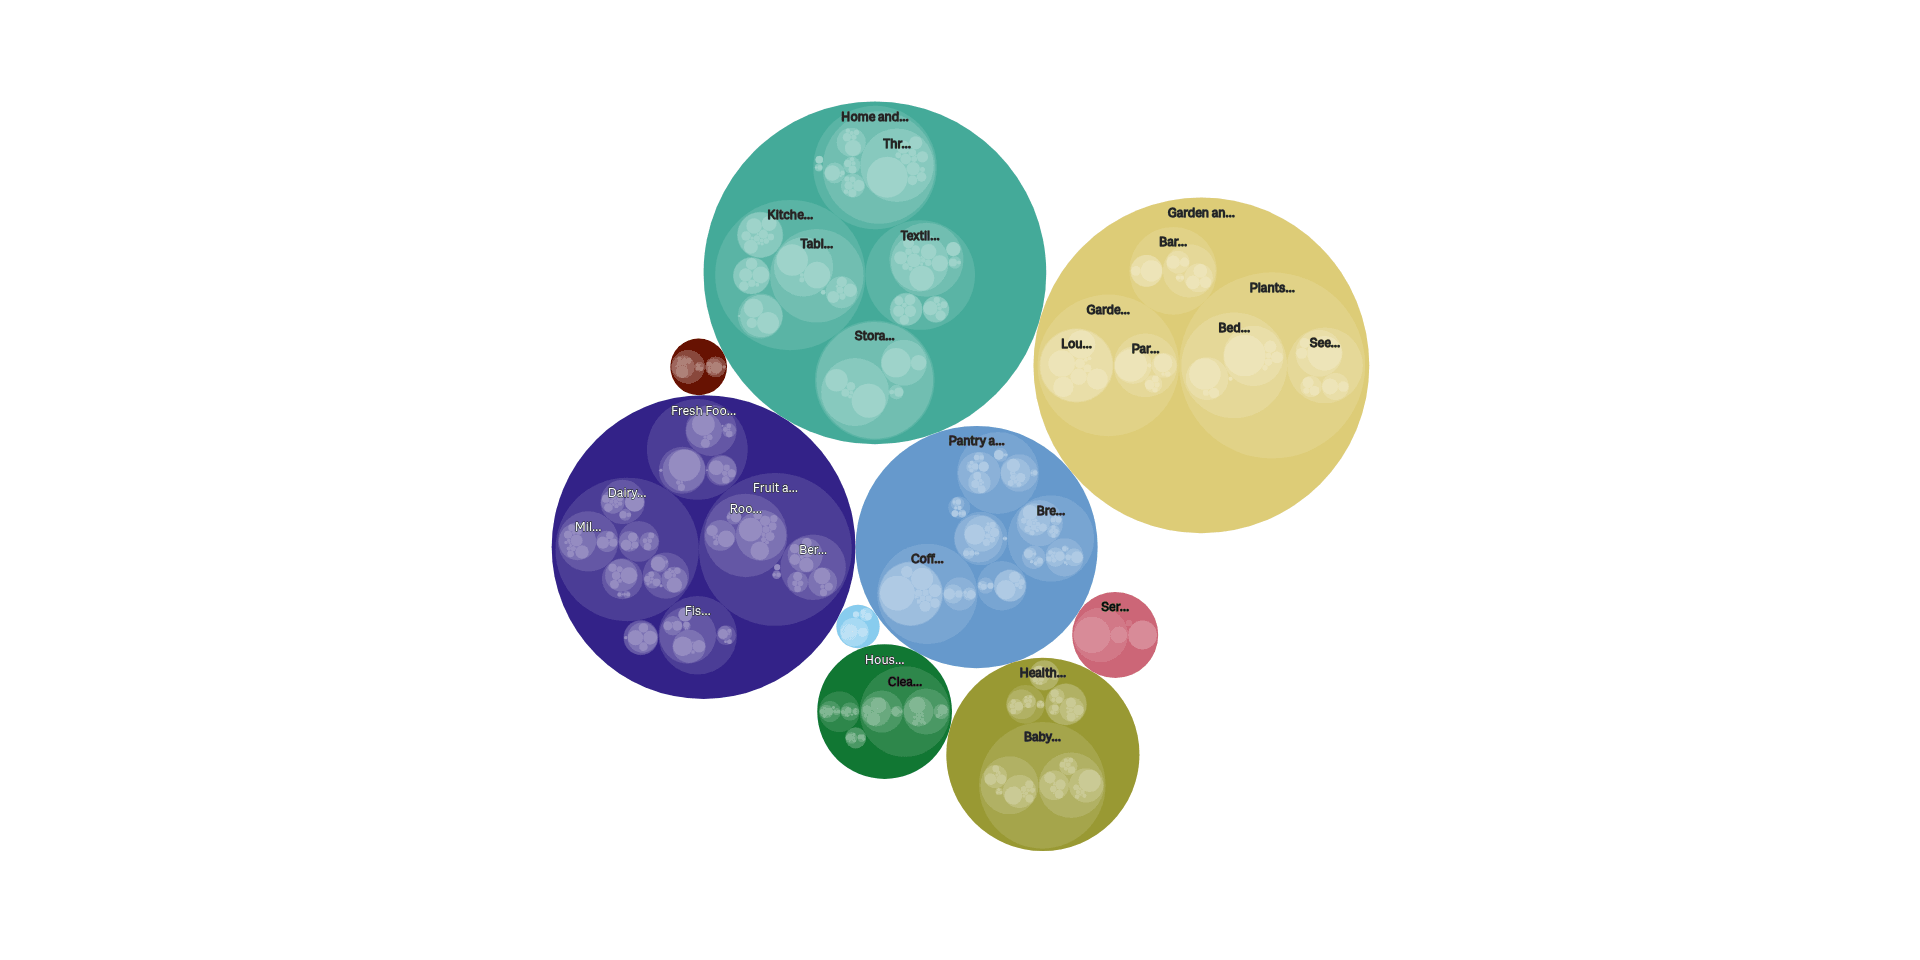
Spot the heavy groups in nested circles
Circle packing nests items inside their group, so the big groups and their parts show at one glance.
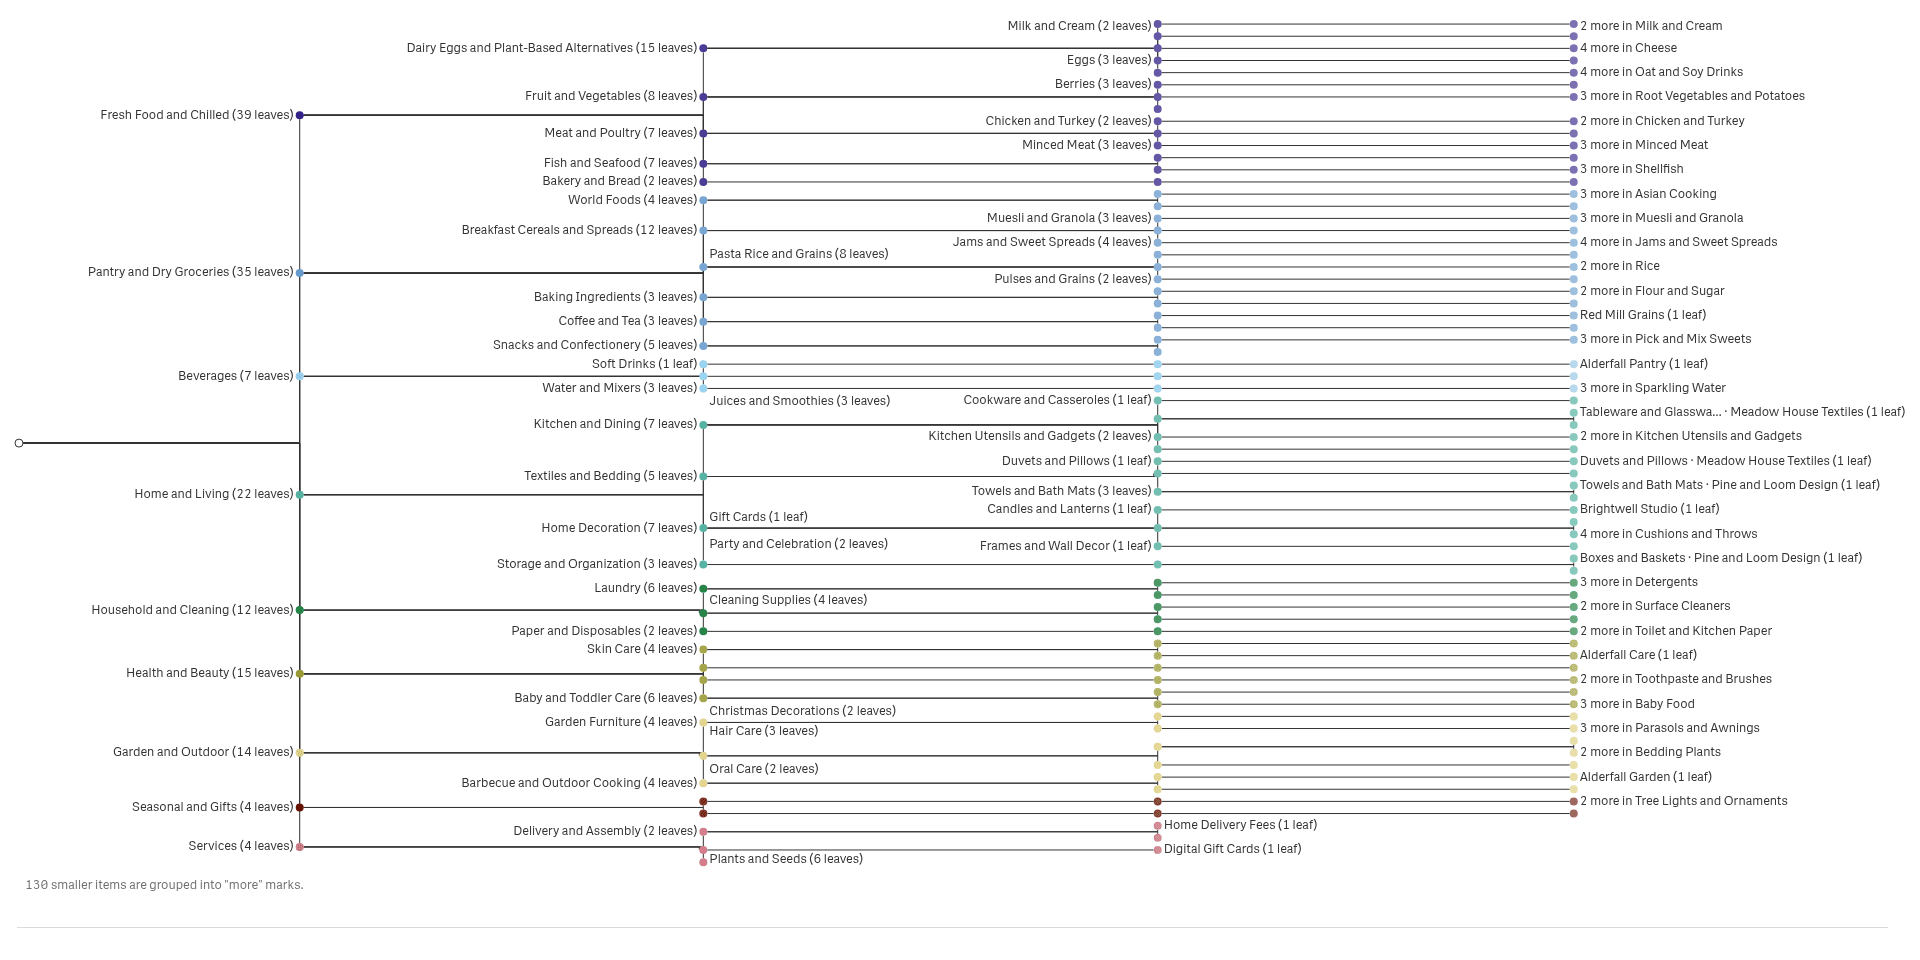
Follow each path as a tree
A tree draws every branch with its label, so you can read a path from the top down to a single item.
See it working
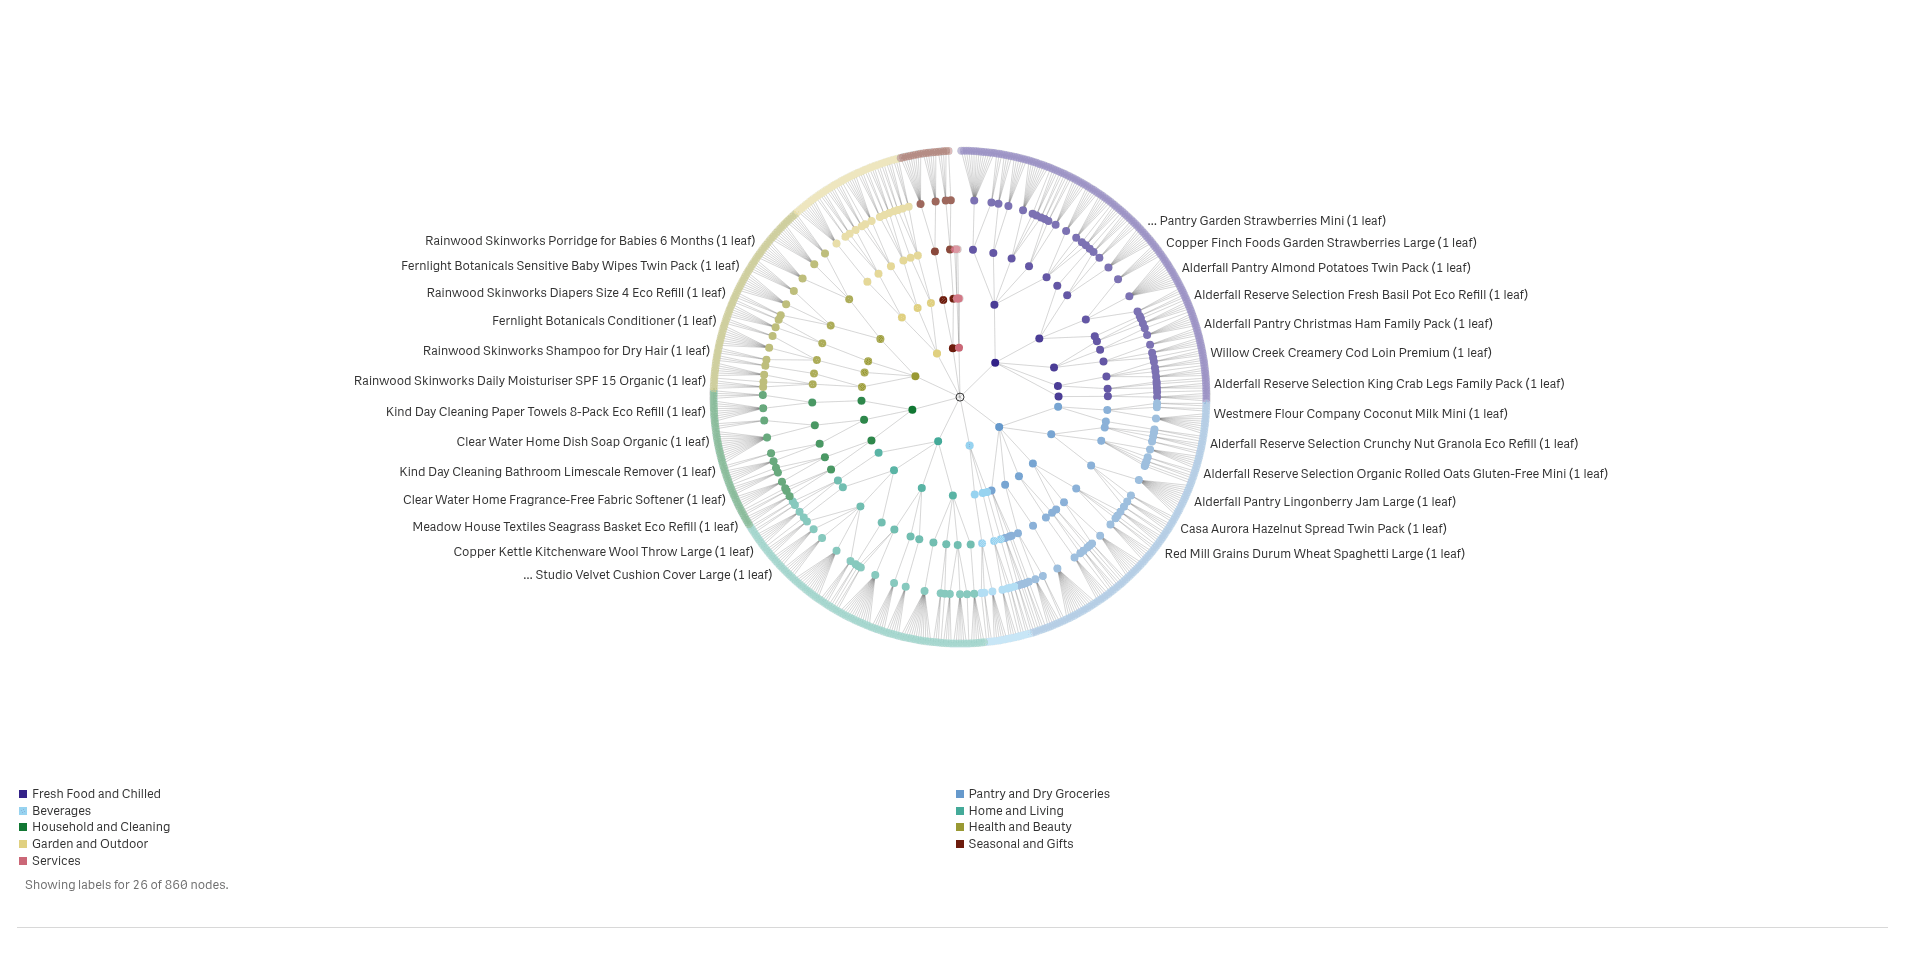 View full size
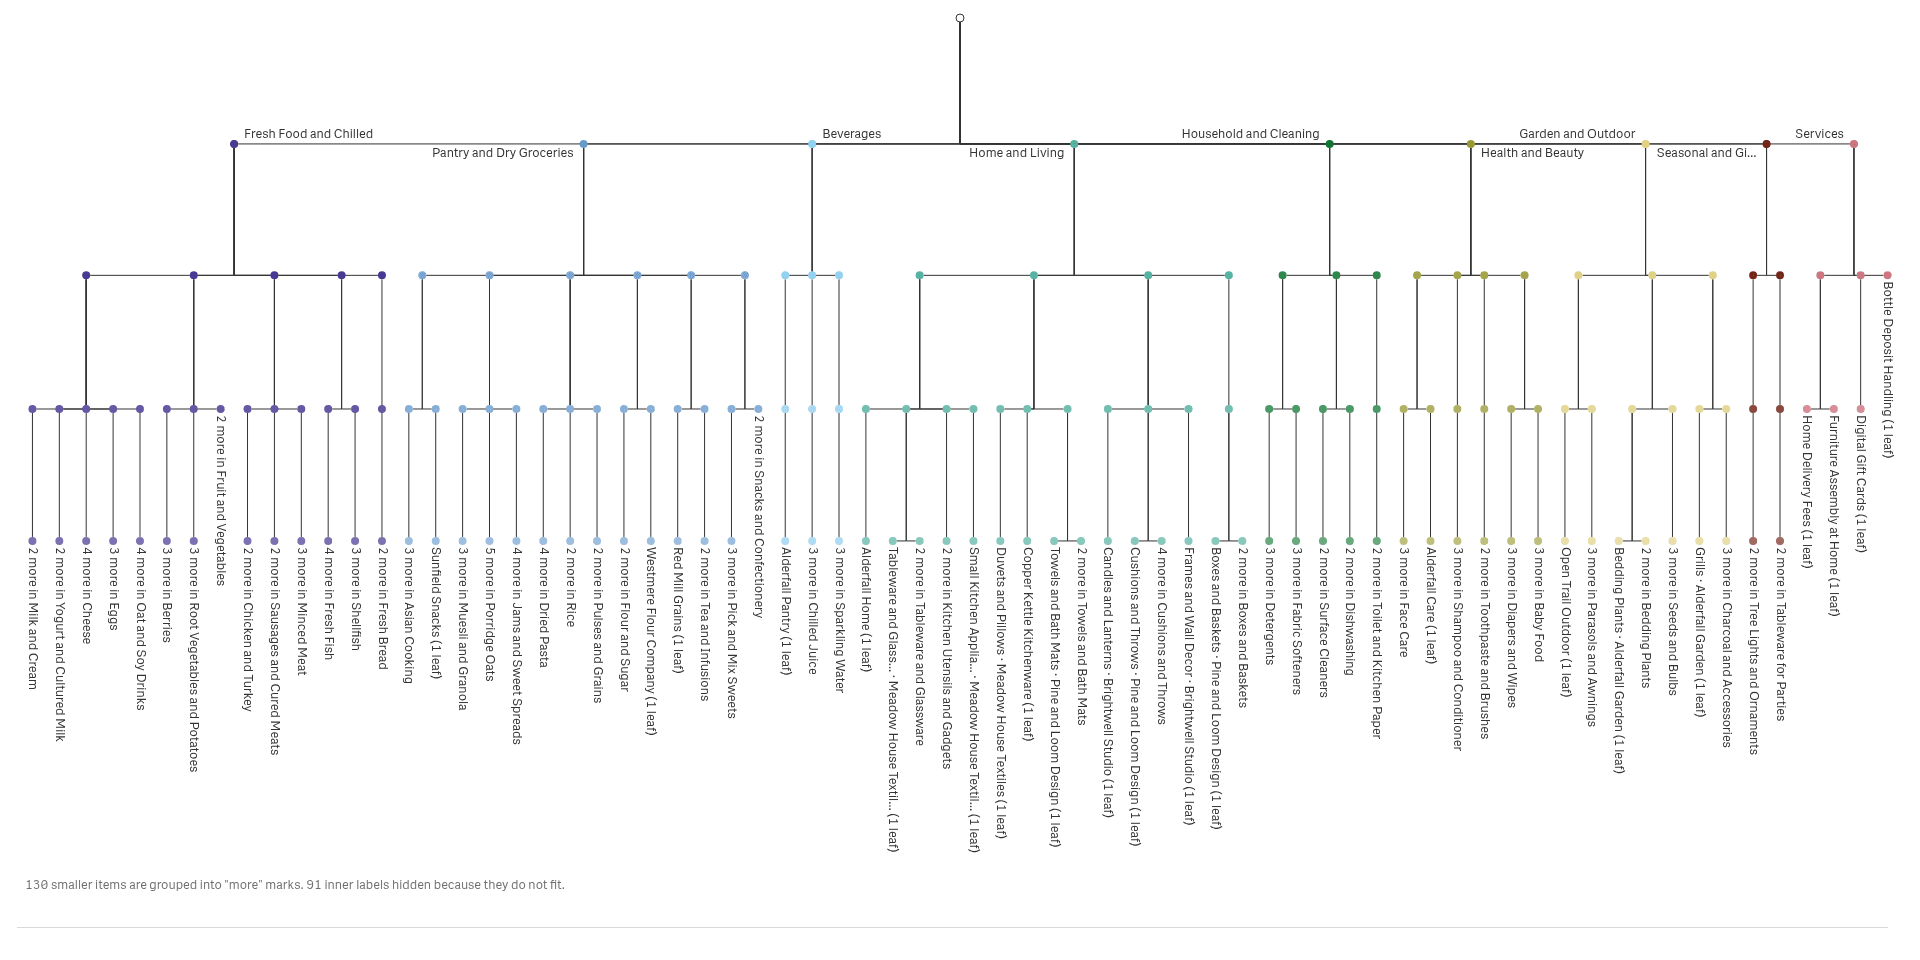 View full size
Try it
Download
Version 2.1.6
Extension
Demo App
Release page on GitHub with every file and its checksum.
Install
Install an extension in Qlik Cloud or client-managed Qlik Sense.
Set up
Install notes
No install notes for this Product. See the general install page.
Docs
Release notes
No release notes yet.
How to get a license
- Review the Product Listing and its documentation.
- E-mail us the Product name, the name of your Qlik Cloud tenant and the number of users.
- We reply to you with the next step.