
Tm Visualization Suite: Multivariate Explorer
Which measures move together, and which stores or items stand apart?
 View full size
Version 2.1.6 · released 2026-11-03
Compare many measures across hundreds of stores at once, and find the ones that behave differently.
What it does
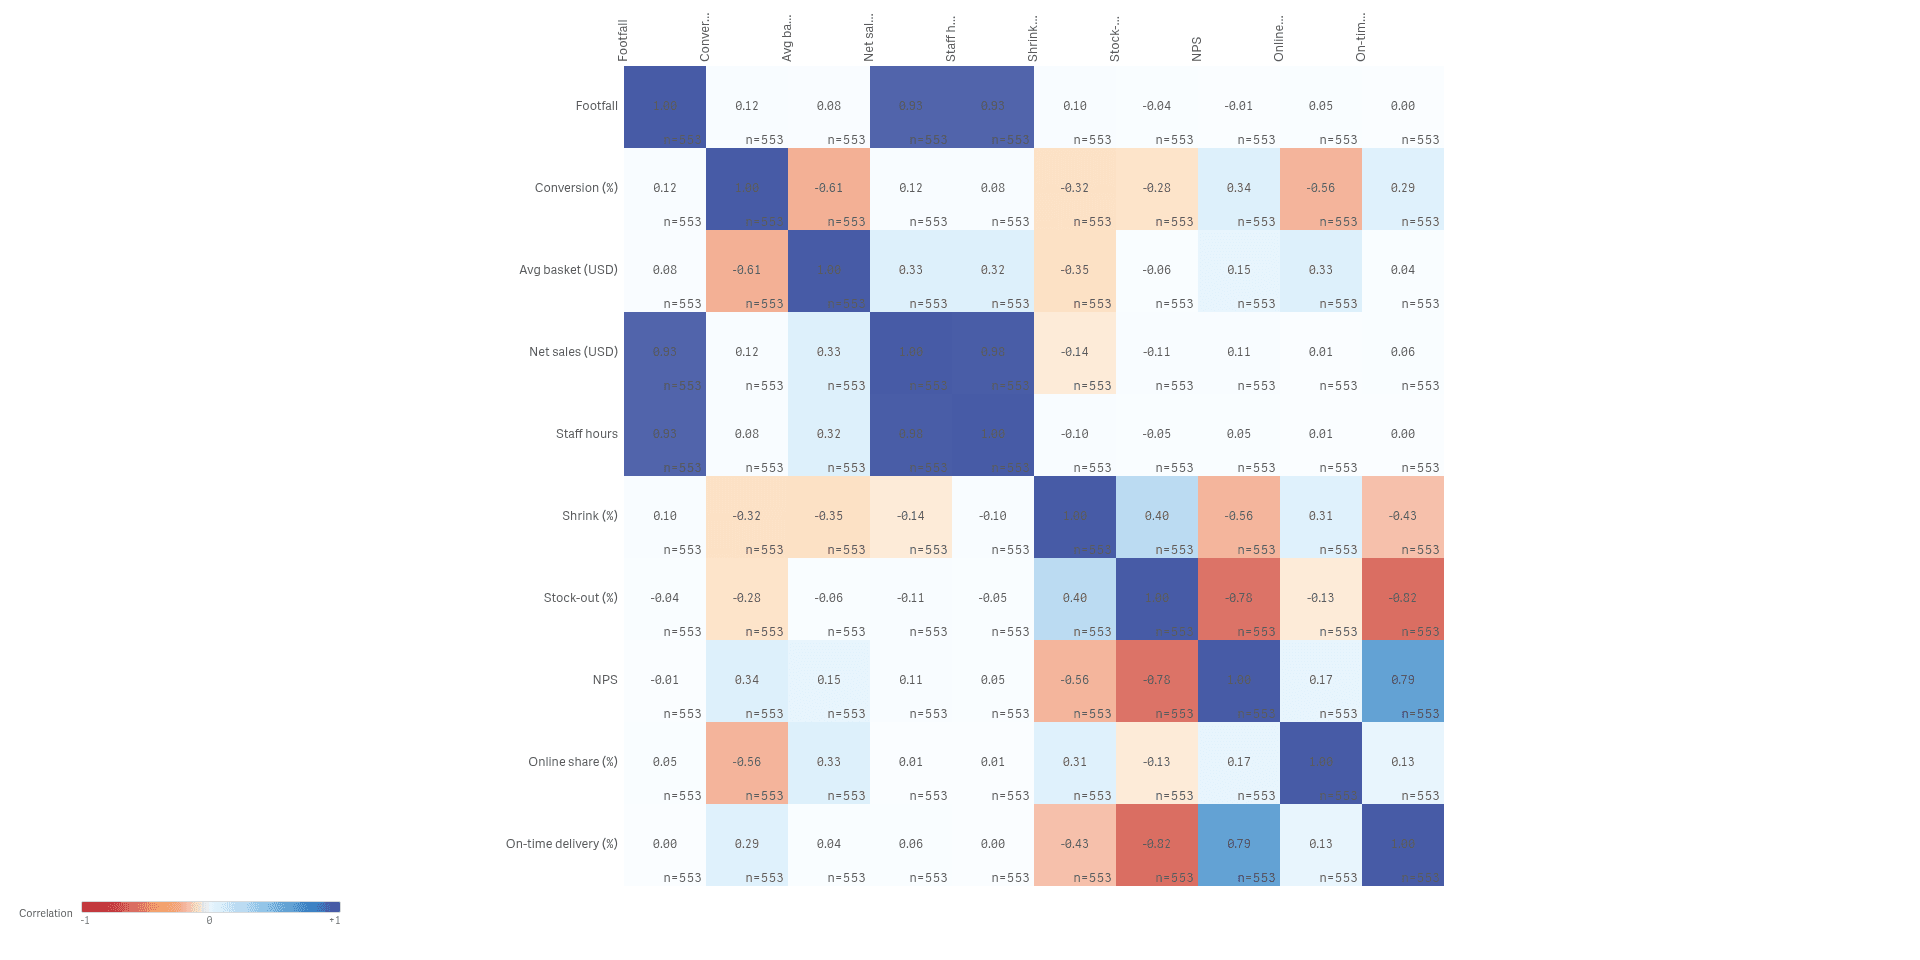
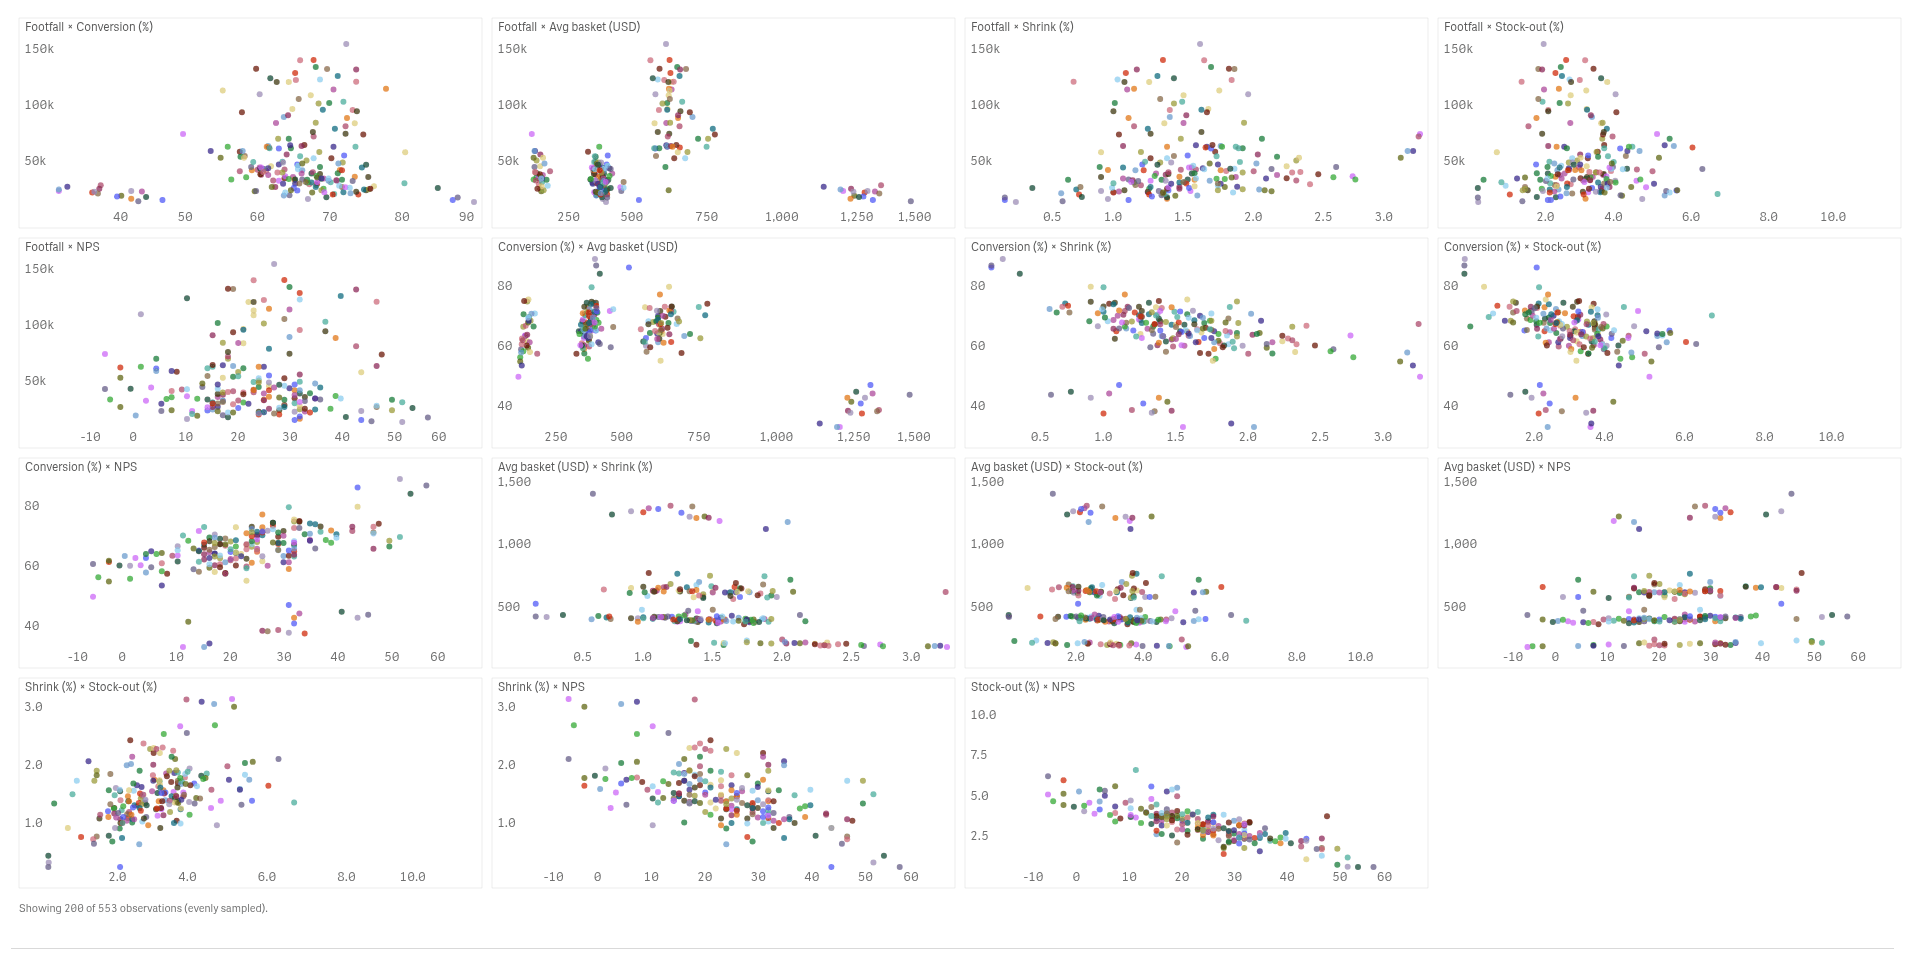
Tm Visualization Suite: Multivariate Explorer compares many measures at once on one Qlik sheet object. A correlation matrix shows which measures move together, a scatter plot matrix draws every pair of measures against each other, and parallel coordinates follow each store across all measures as one line.
Select a year or a group in Qlik and every view follows. The charts read your data and never change it. Large data sets are shown as a sample, and a note says how many observations are drawn.
Analysts and BI leads who study many measures at once for stores, products or customers.
Good for
- Which measures rise and fall together?
- Which stores stand out across several measures?
- How did the picture change from one year to the next?
Key features
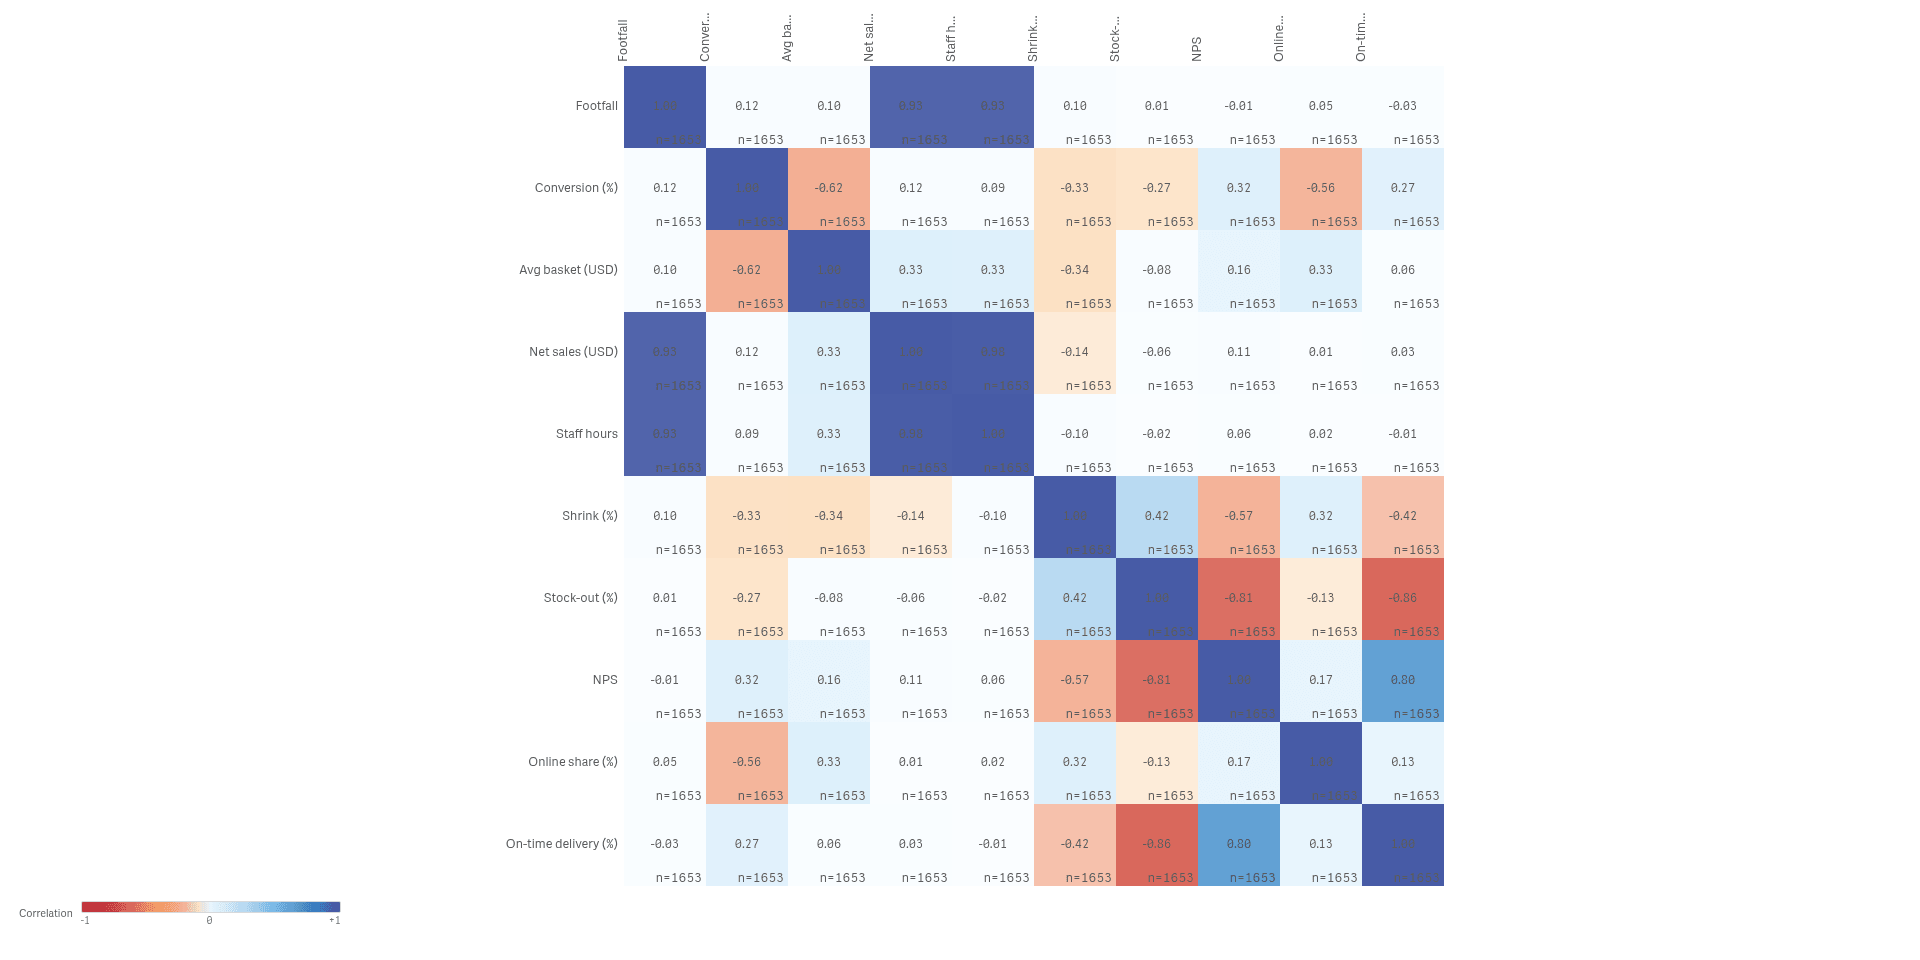
Find which measures move together
A correlation matrix colours each pair of measures, so strong links and opposites show at a glance.
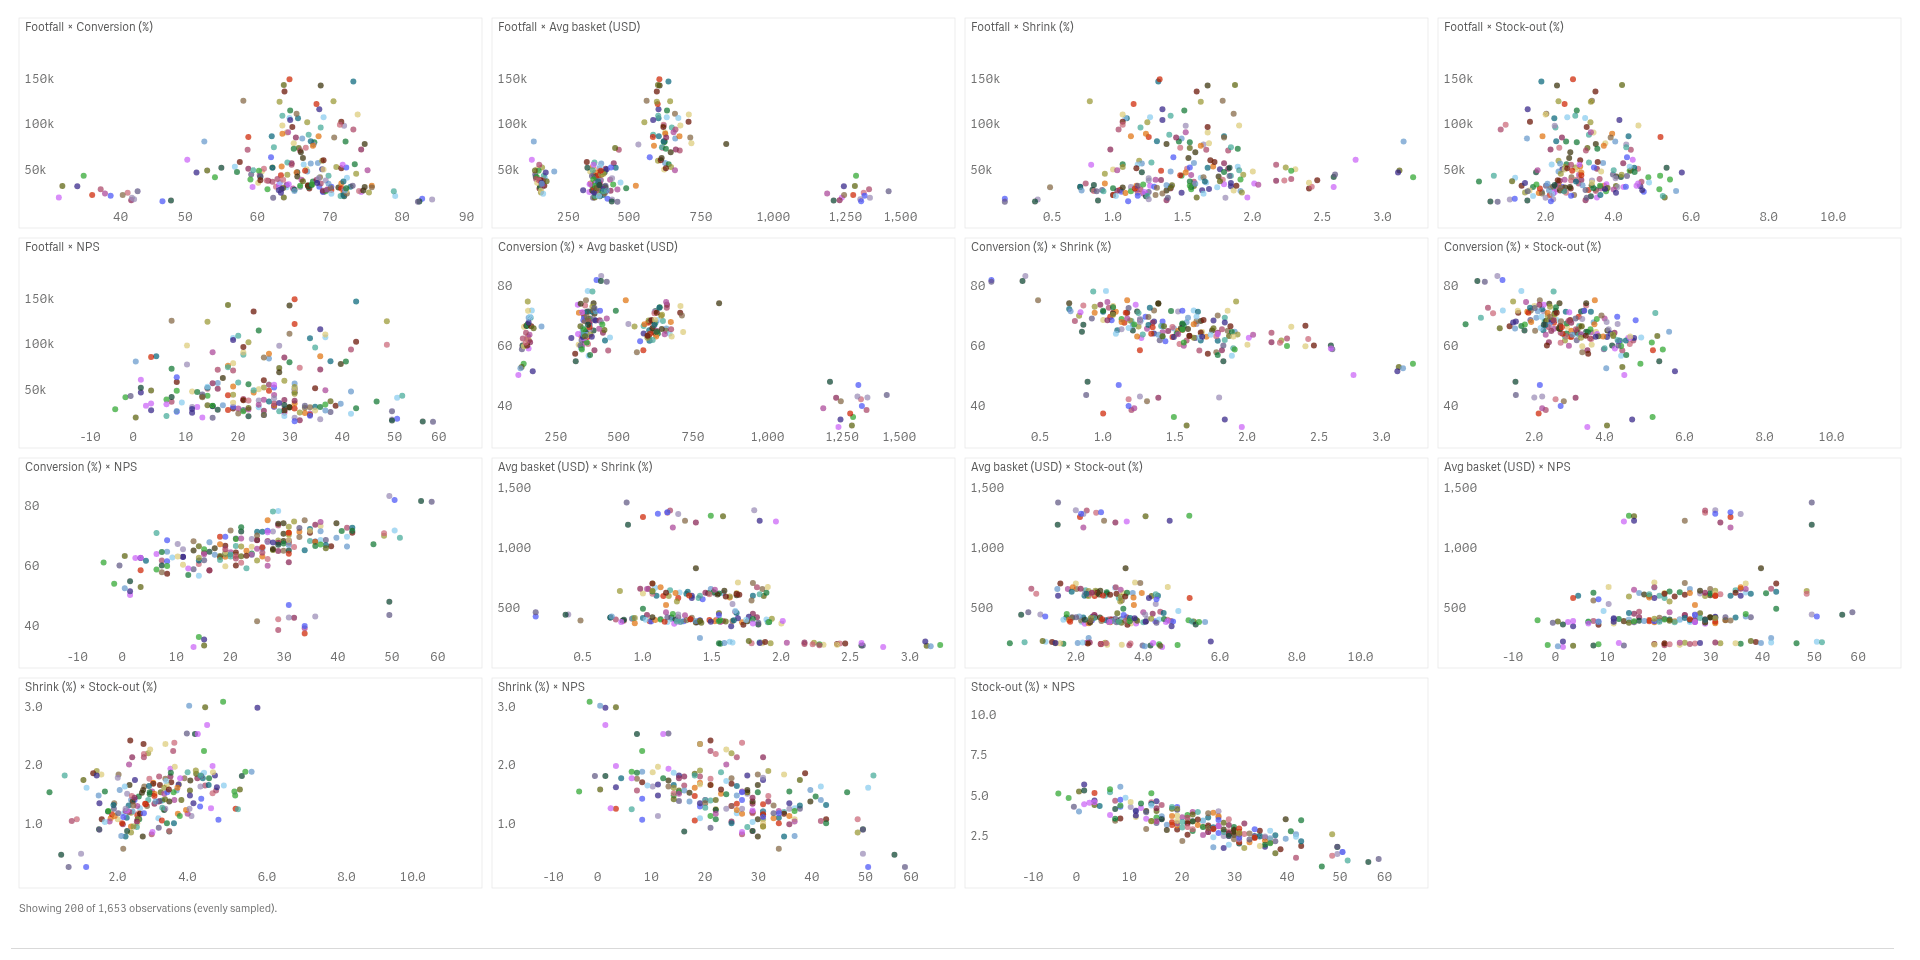
See every pair as its own plot
A scatter plot matrix draws each pair of measures against each other, so you see the shape behind a number.
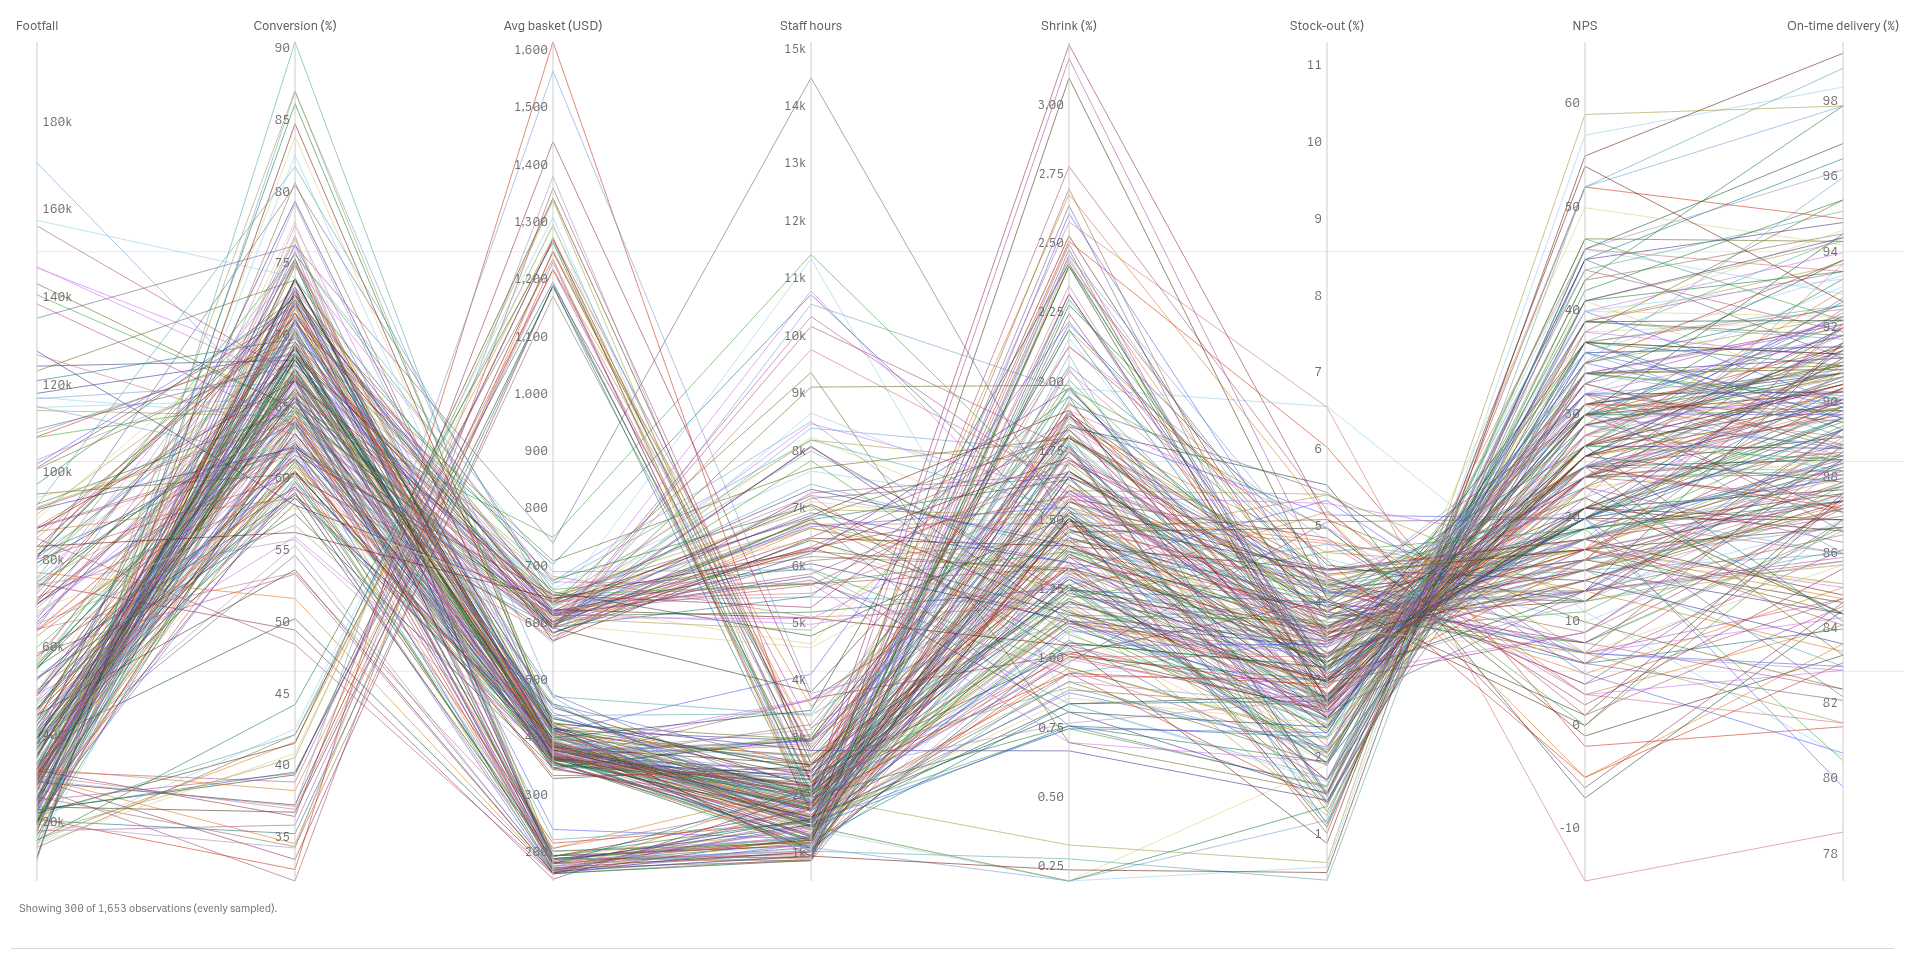
Follow each store across all measures
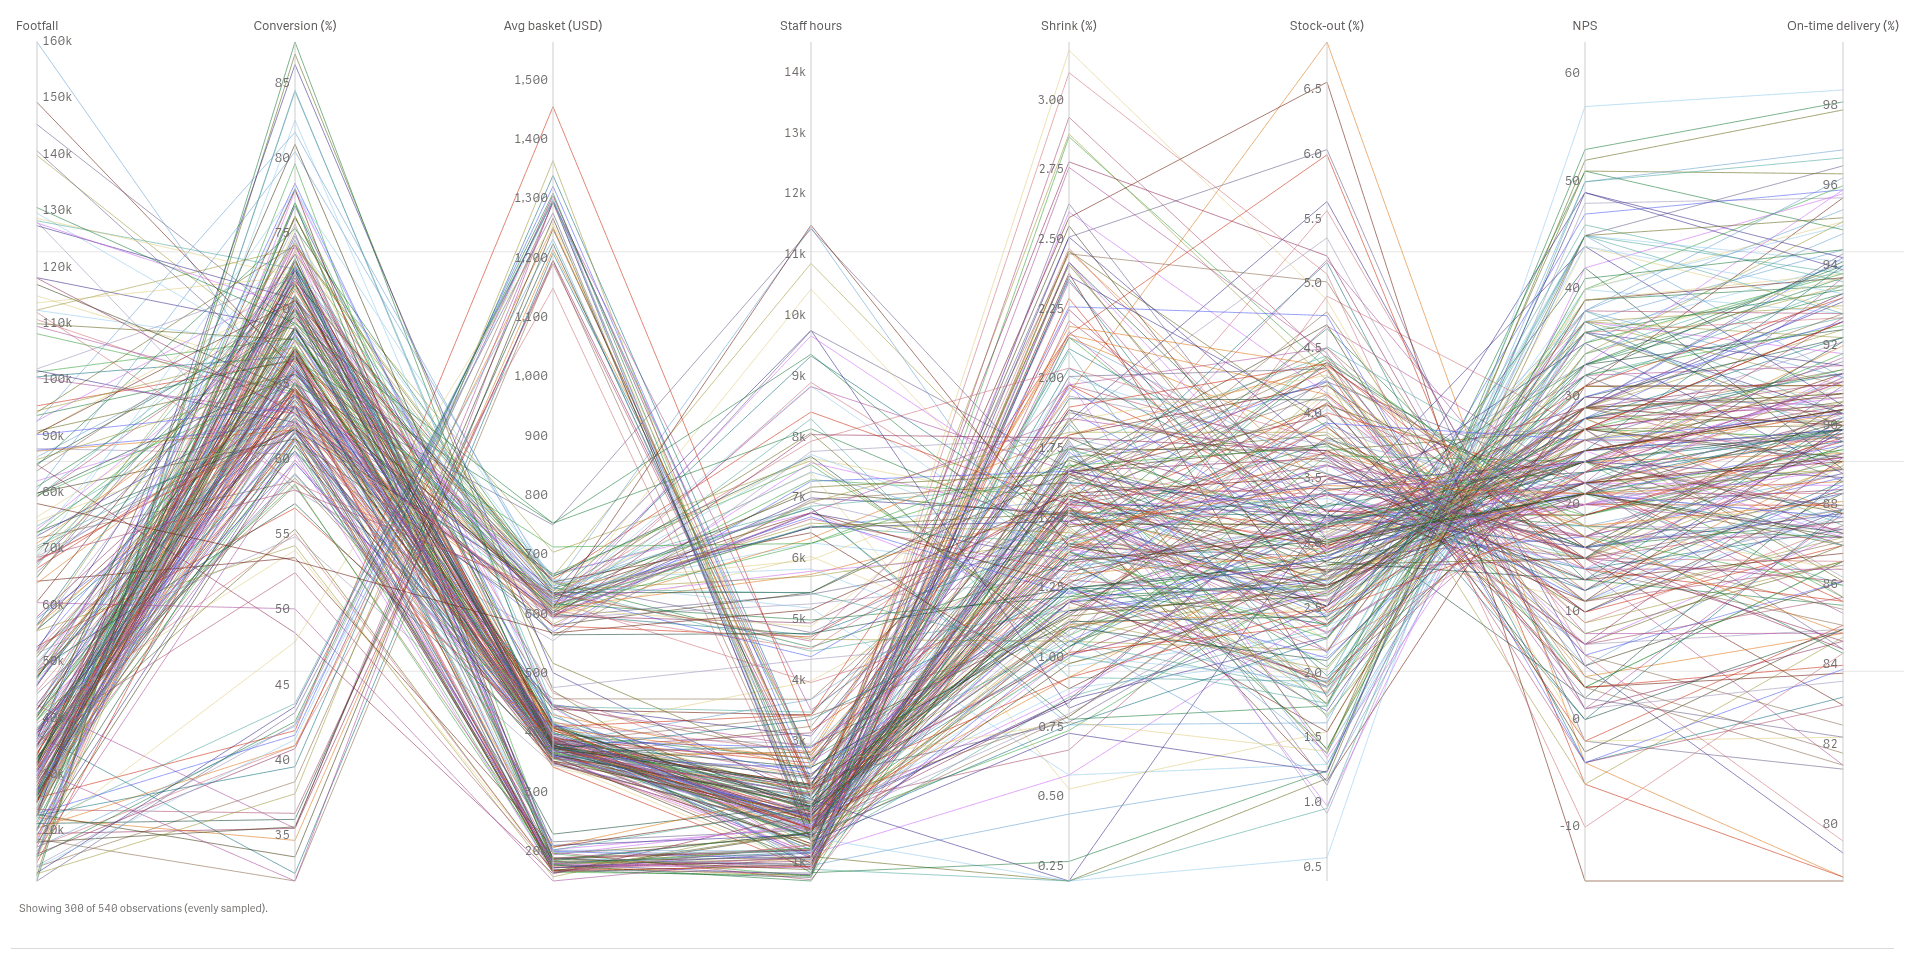
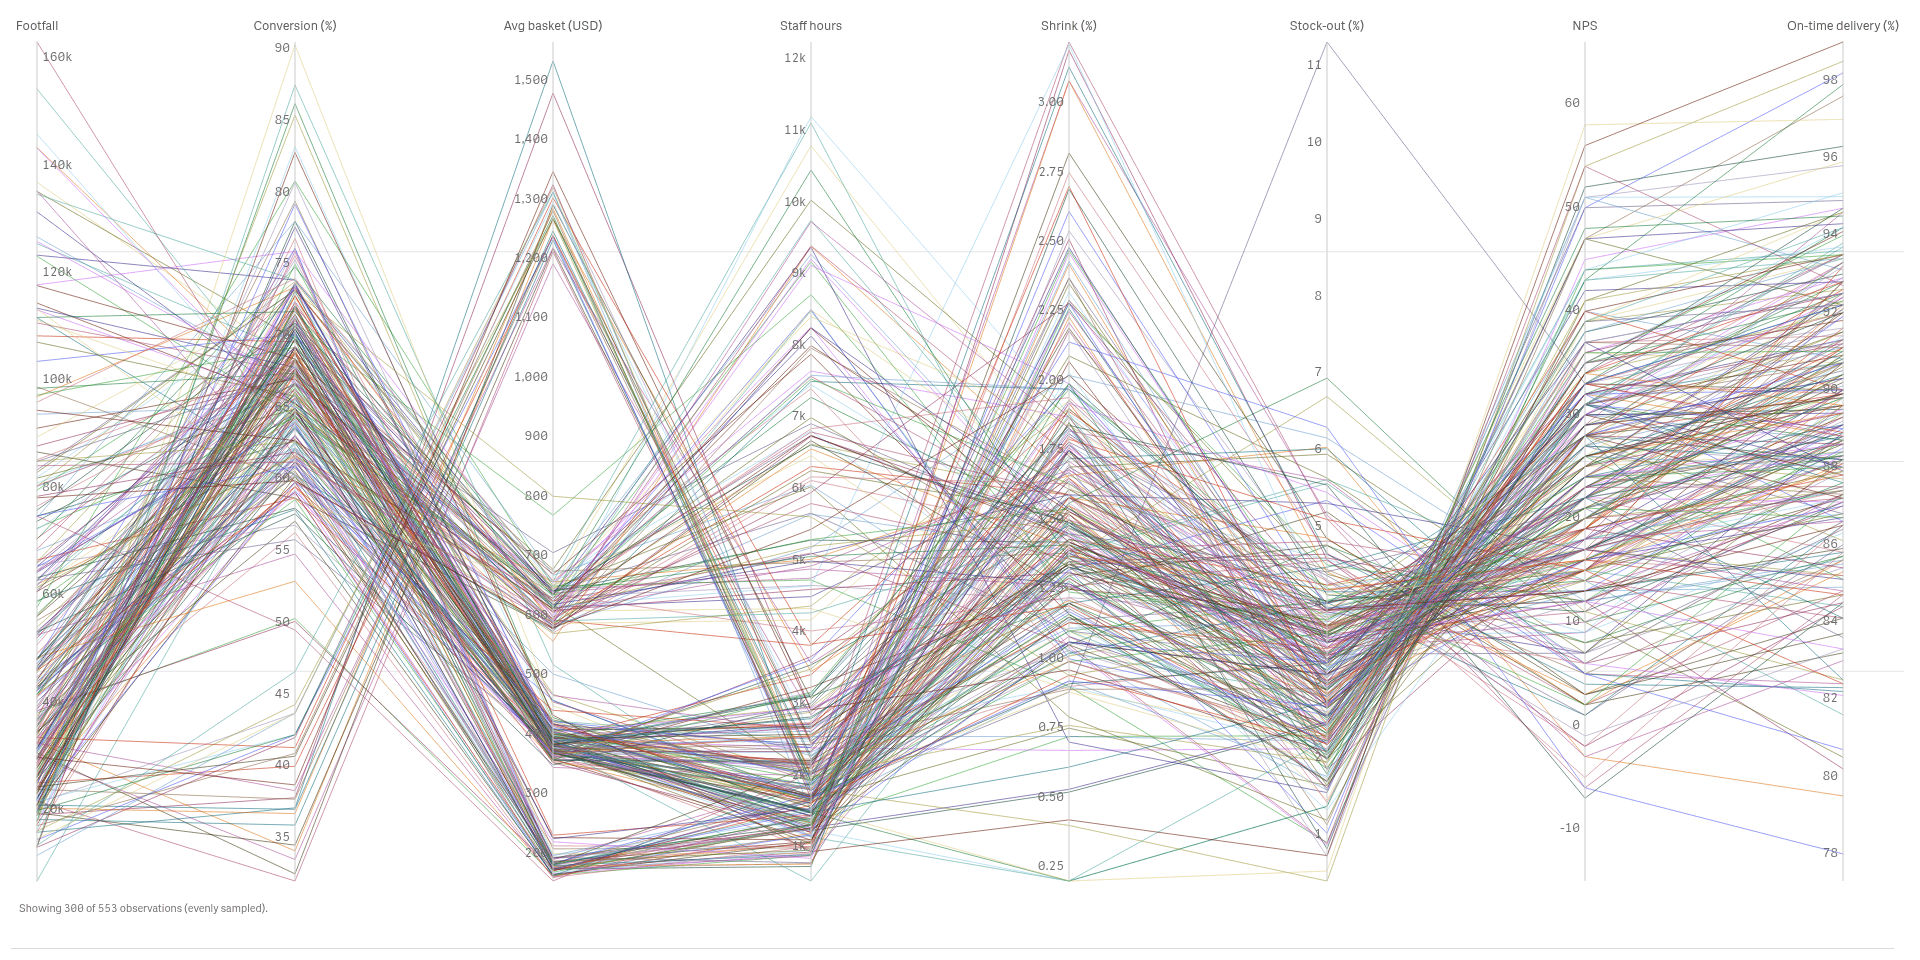
Parallel coordinates draw one line per store through every measure, so you see who is high on one and low on another.
Compare one year with another
Select a year and the lines show only that year, so a change in pattern is easy to see.
See it working
 View full size
 View full size
Try it
Download
Version 2.1.6
Extension
Demo App
Release page on GitHub with every file and its checksum.
Install
Install an extension in Qlik Cloud or client-managed Qlik Sense.
Set up
Install notes
No install notes for this Product. See the general install page.
Docs
Release notes
No release notes yet.
How to get a license
- Review the Product Listing and its documentation.
- E-mail us the Product name, the name of your Qlik Cloud tenant and the number of users.
- We reply to you with the next step.