
Tm Visualization Suite: Process Explorer
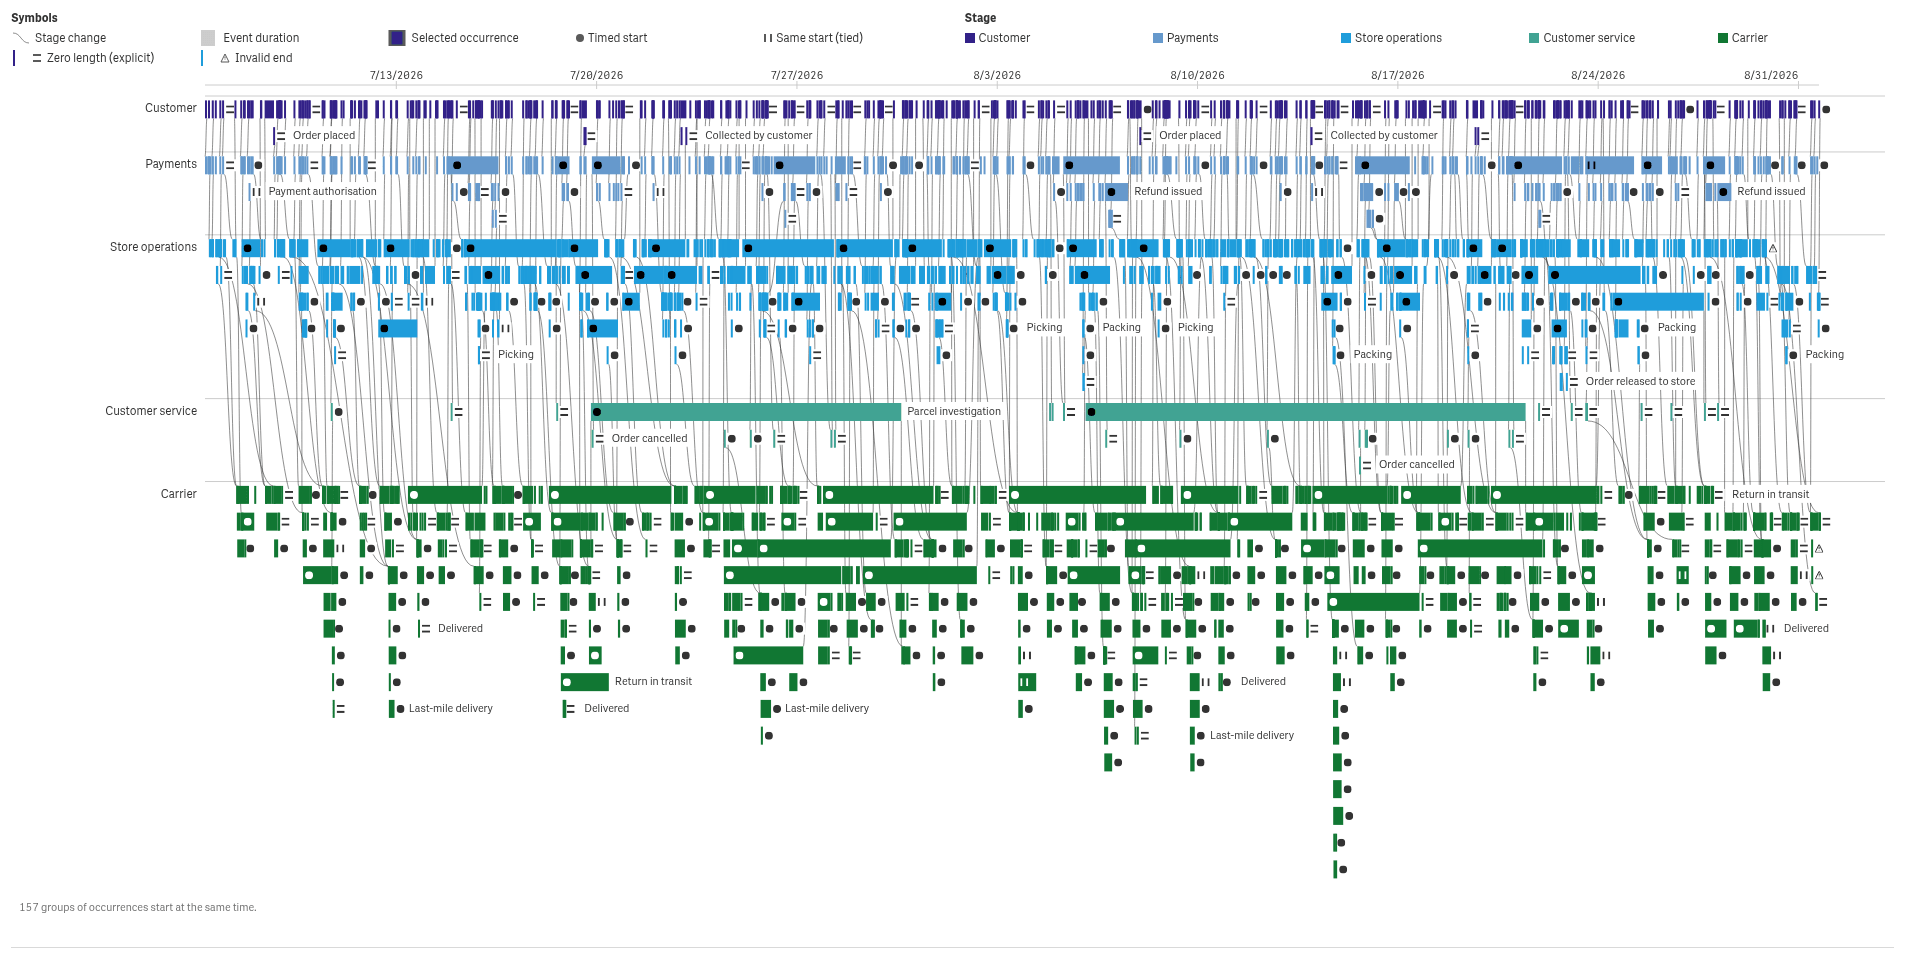
How do cases move through a process, and where do they get stuck?
 View full size
Version 2.1.6 · released 2026-11-03
Follow every order through its steps, and see where it waits, loops or takes a detour.
What it does
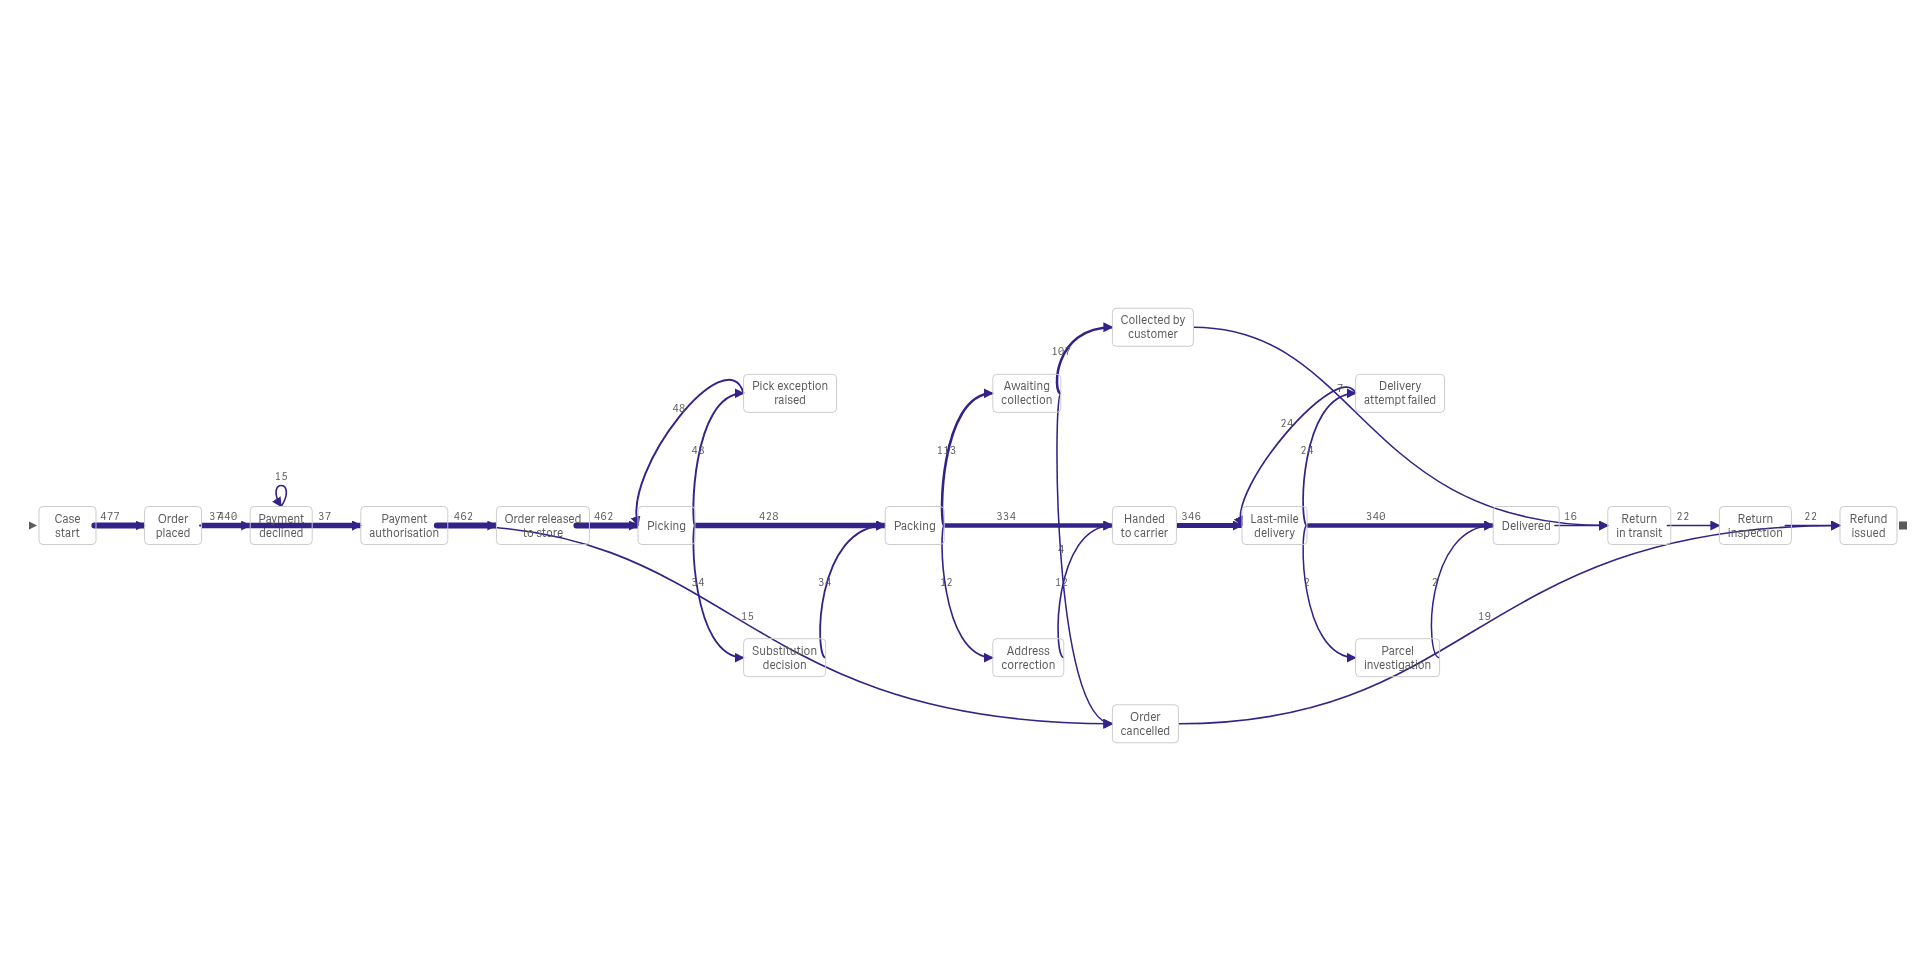
Tm Visualization Suite: Process Explorer shows how cases move through a process on one Qlik sheet object. See each order as a row of events, group the work by team in lanes, line up the steps of many cases, mark milestones, or follow the typical journey from stage to stage.
Click a case or an event to select the data behind it, and the rest of the sheet follows. The charts read your data and never change it. Large event logs show the busiest cases first, with a note on how many are shown.
Analysts and BI leads who study how orders, tickets or cases flow through a process.
Good for
- Where do orders wait the longest?
- Which paths do cases take, and how often?
- Where does the process loop back or fail?
Key features
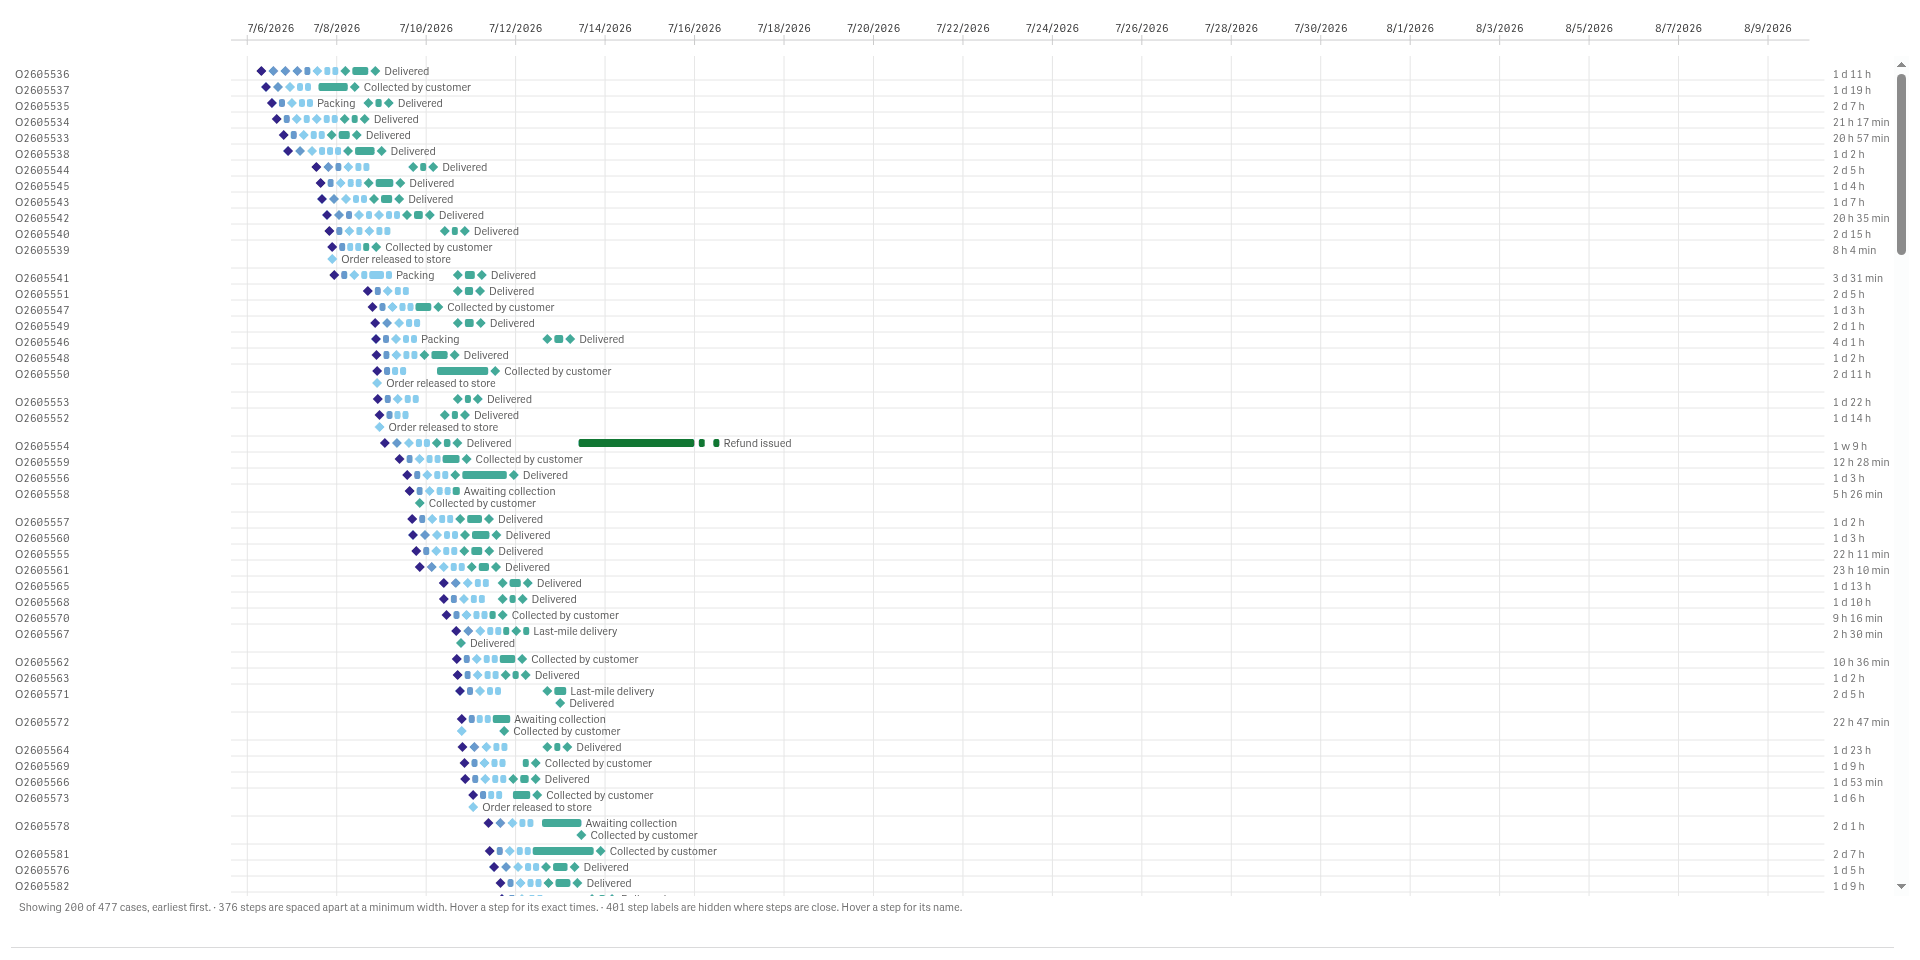
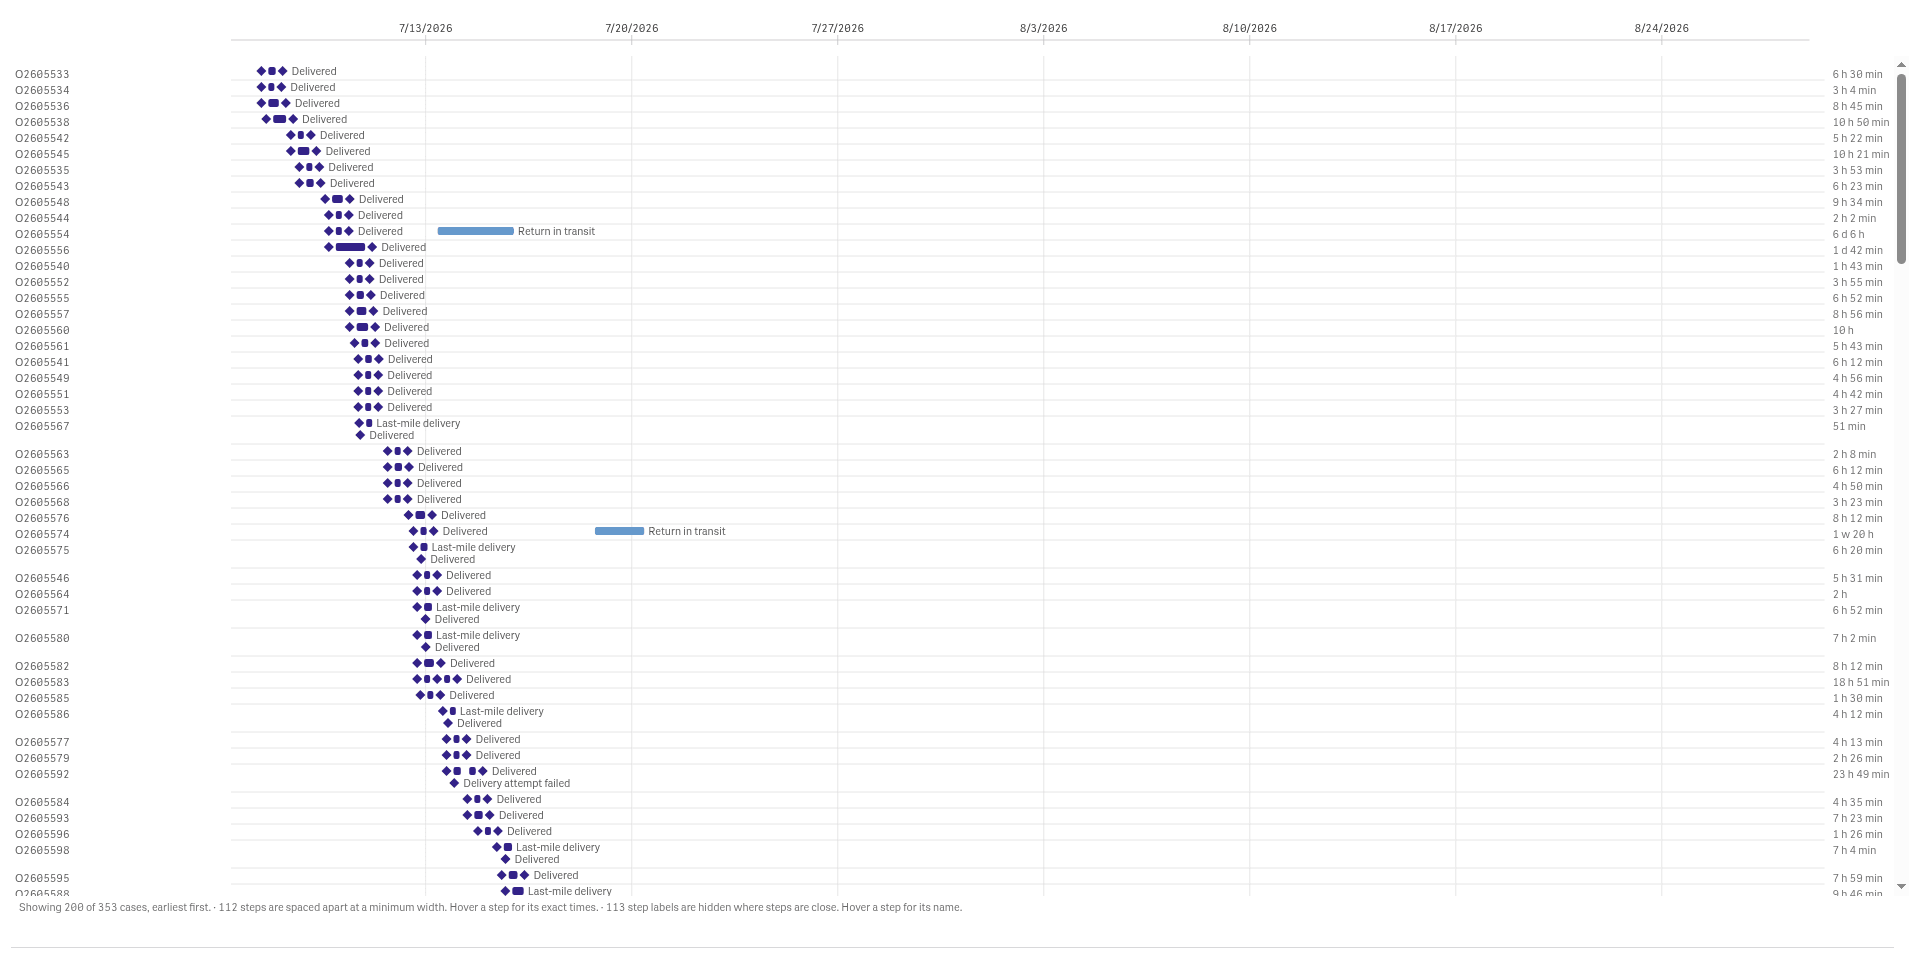
See each case as a row of events
A trace gives every order its own row, with each step on the time axis, so slow cases are easy to find.
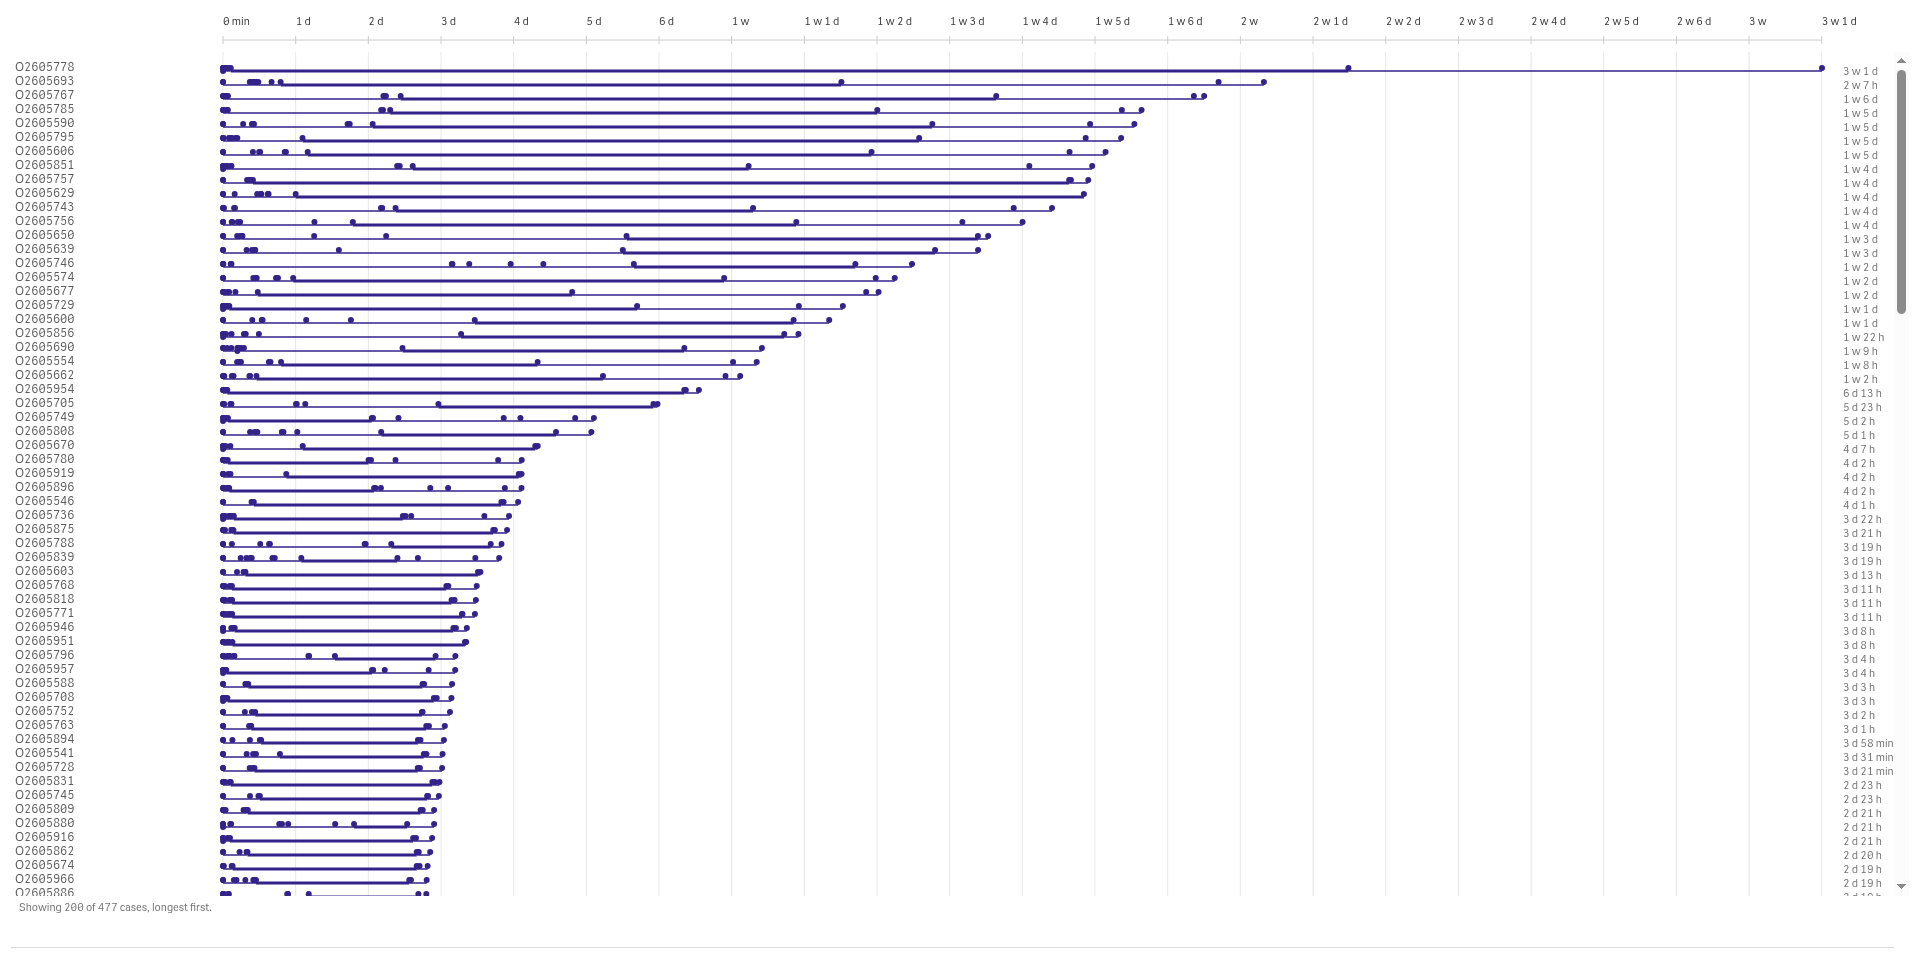
Line up the steps of many cases
An event sequence orders the steps of each case, so you compare how different cases unfold.
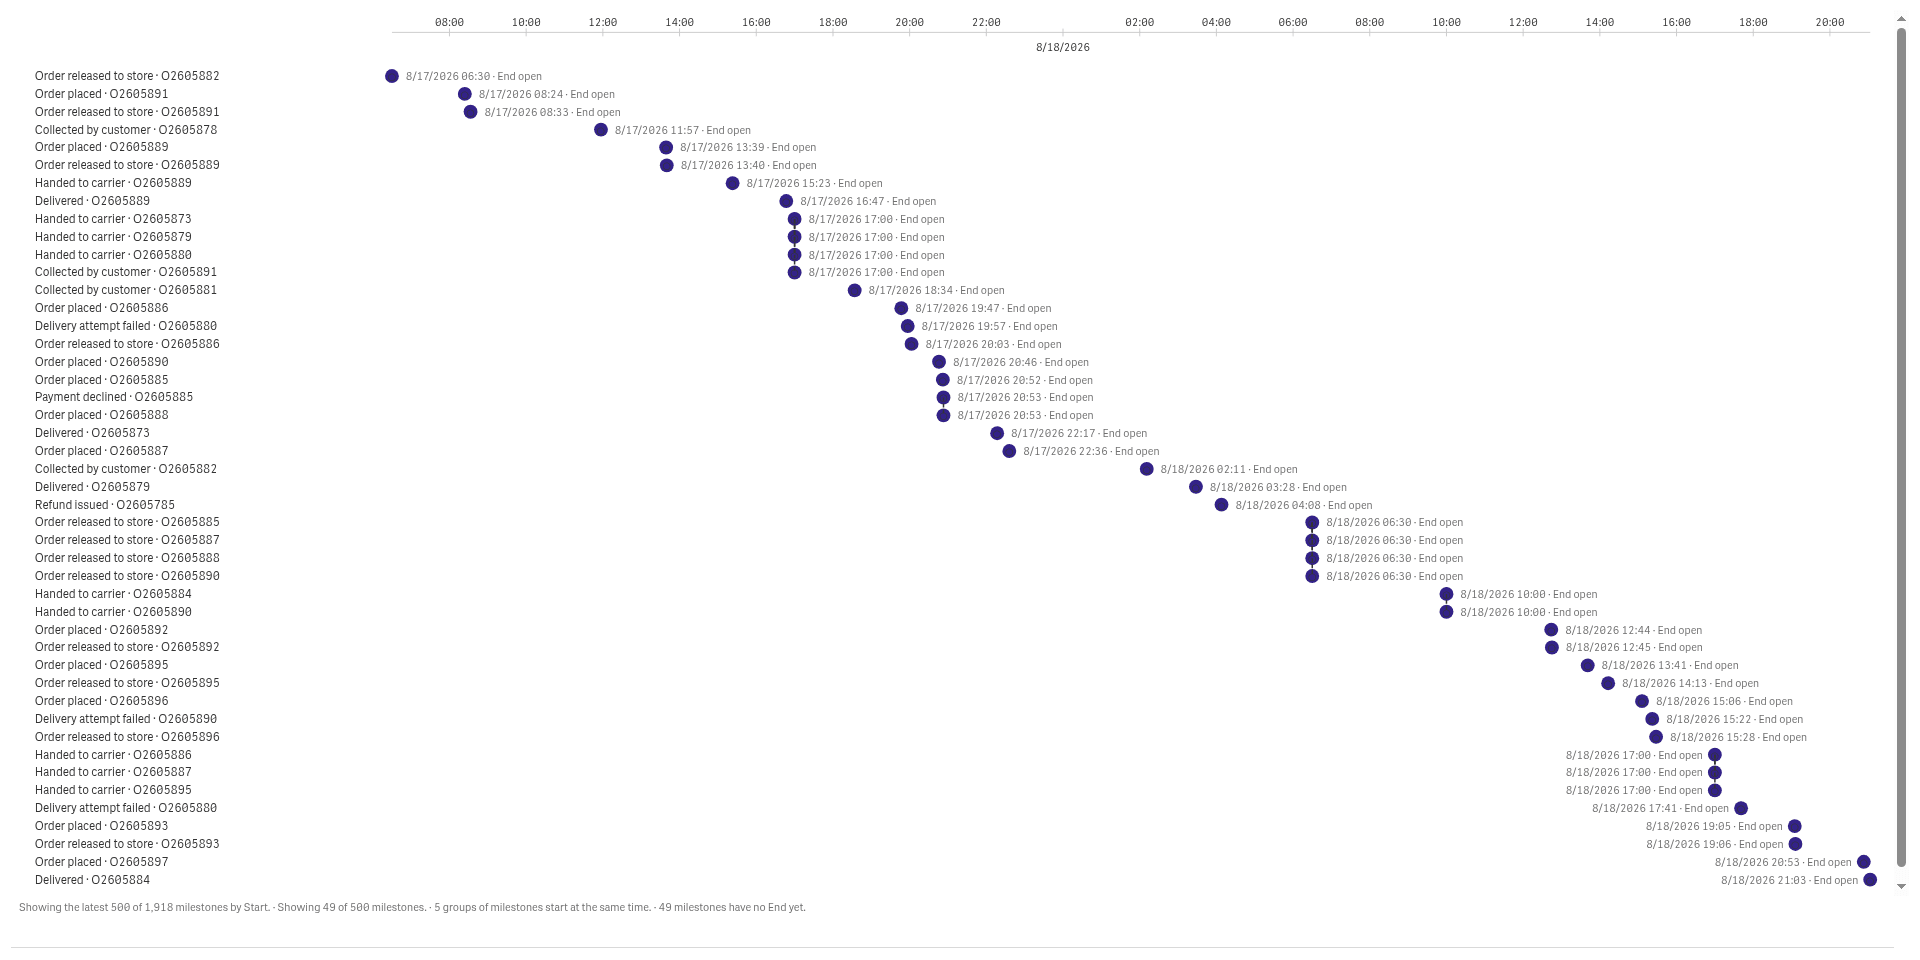
Mark the moments that matter
Milestones show when each case reaches a key stage, so you see which cases reach it late.
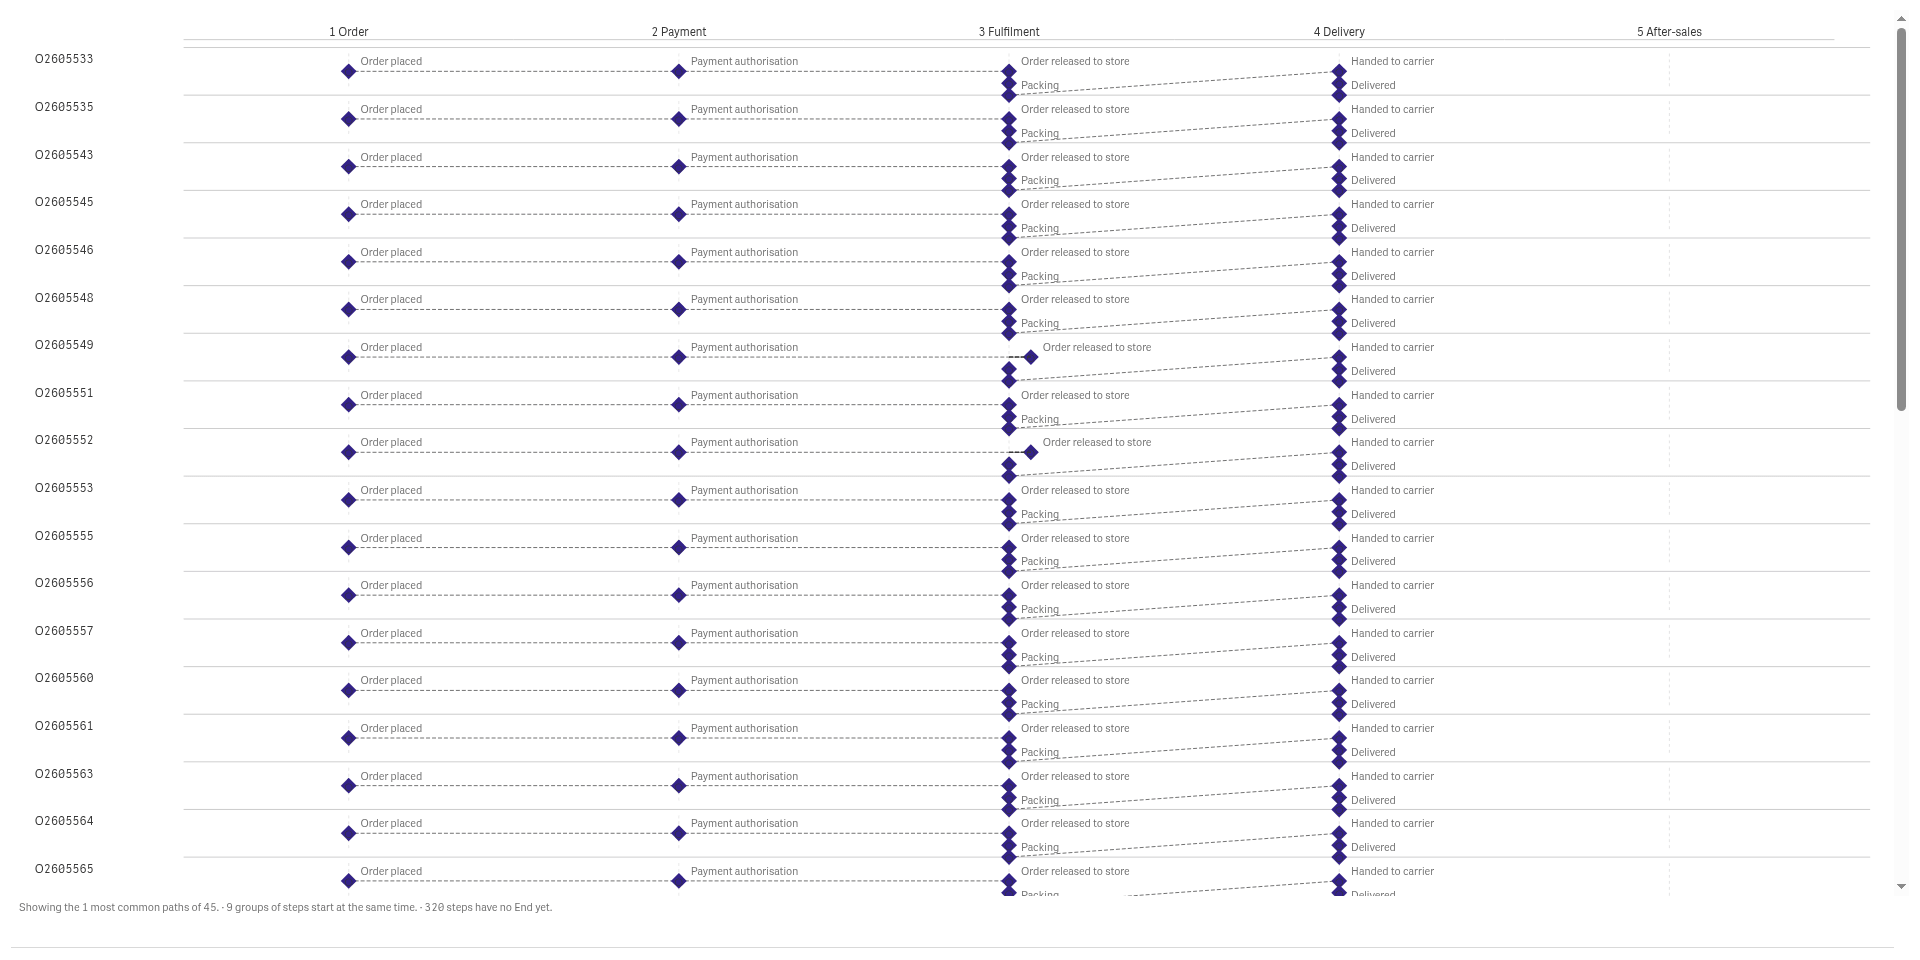
Follow the typical journey
A journey chart lines the cases up by stage, so you see which stage each one reaches and when.
See it working
 View full size
 View full size
Try it
Download
Version 2.1.6
Extension
Demo App
Release page on GitHub with every file and its checksum.
Install
Install an extension in Qlik Cloud or client-managed Qlik Sense.
Set up
Install notes
No install notes for this Product. See the general install page.
Docs
Release notes
No release notes yet.
How to get a license
- Review the Product Listing and its documentation.
- E-mail us the Product name, the name of your Qlik Cloud tenant and the number of users.
- We reply to you with the next step.