
Tm Visualization Suite: Relationship Explorer
Who is connected to whom, and how strong are the links?
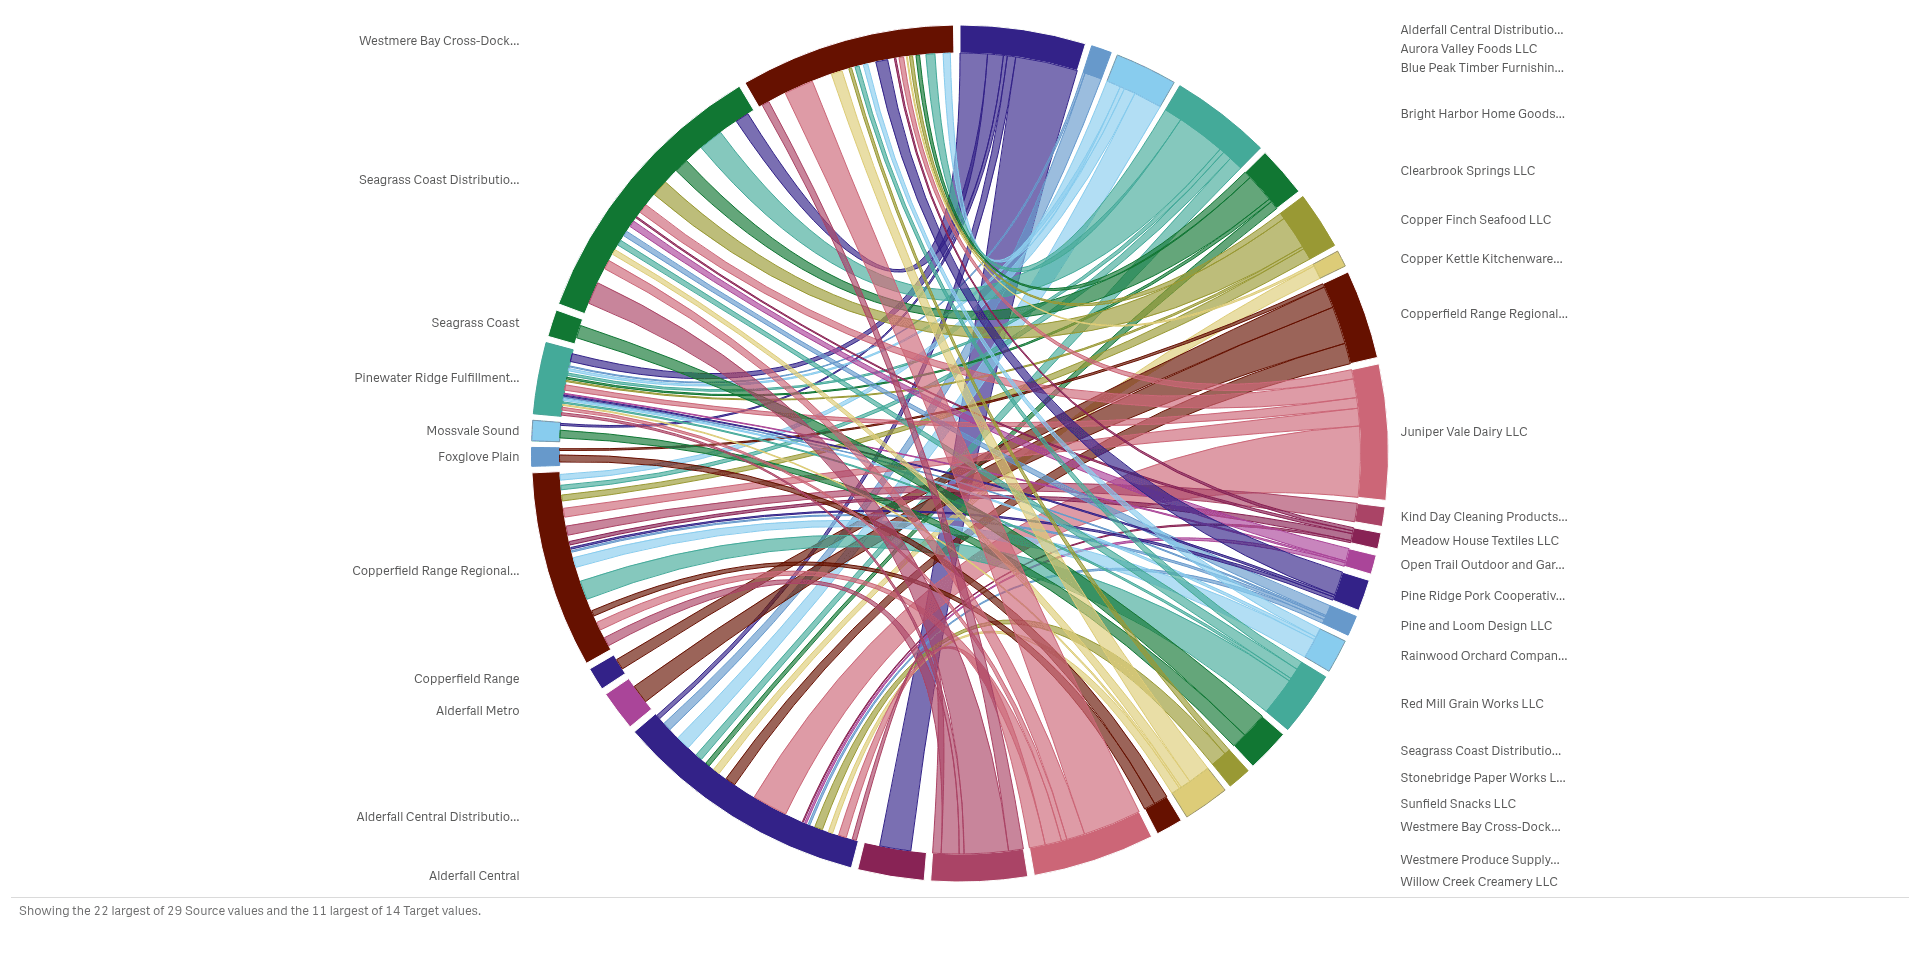 View full size
Version 2.1.6 · released 2026-11-03
See how suppliers, sites and customers connect, and which links carry the most volume.
What it does
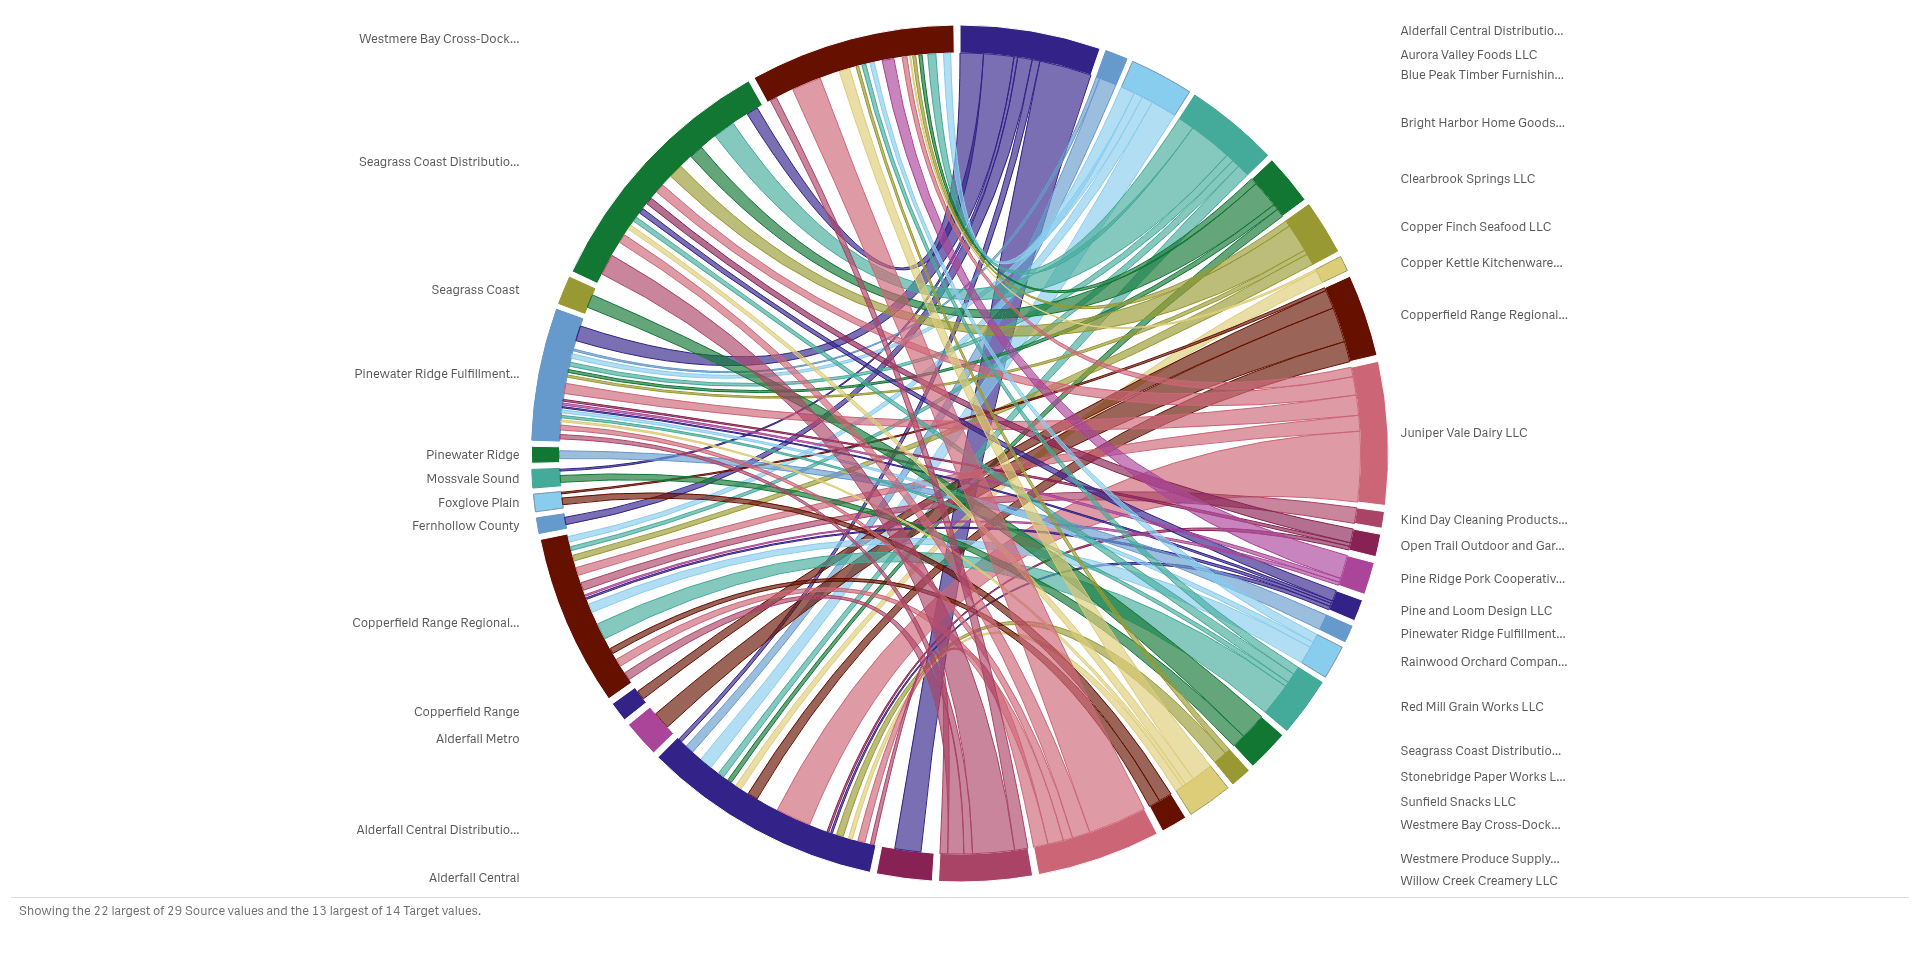
Tm Visualization Suite: Relationship Explorer shows how things connect on one Qlik sheet object. A chord diagram, a flow between two stages, a network, an arc diagram and a matrix all draw the same links in a different way, so you pick the one that makes your question clear.
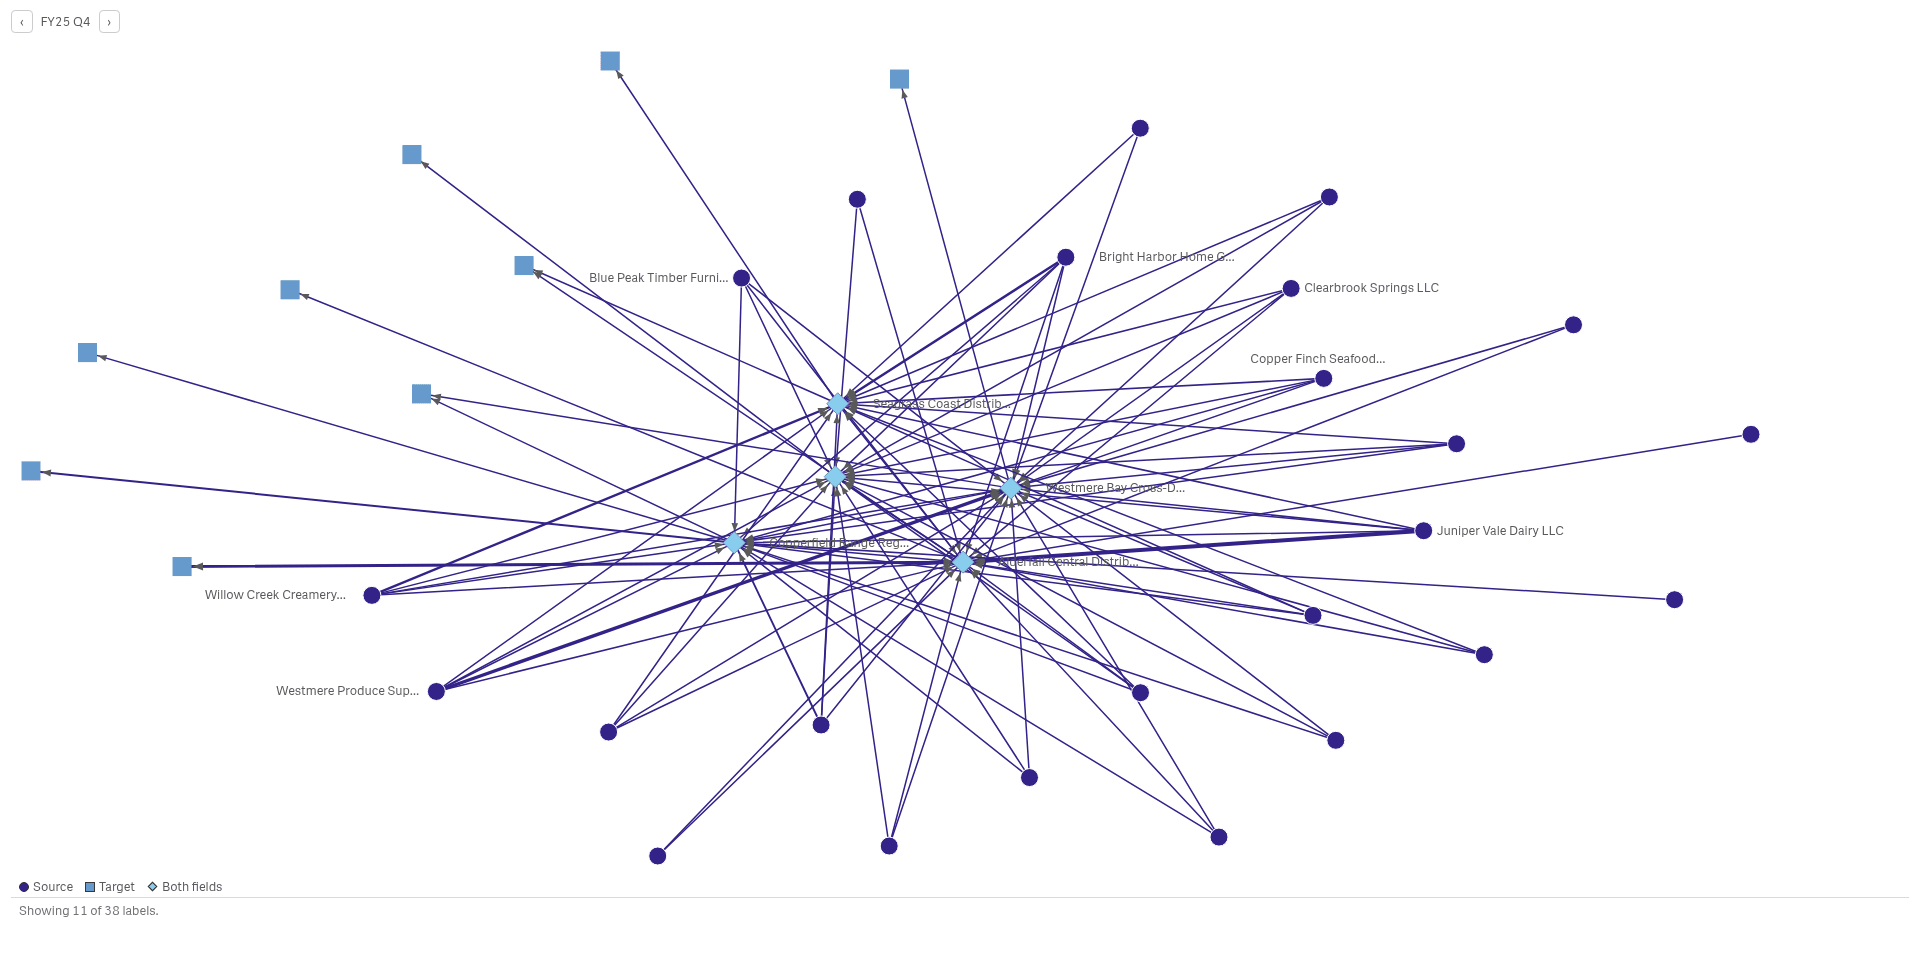
Click a node or a link to select the data behind it, and the rest of the sheet follows. The charts read your data and never change it. Large networks show the strongest links first, with a note on how many nodes and labels are shown.
Analysts and BI leads who study flows and links between suppliers, sites, teams or customers.
Good for
- Which suppliers deliver to which distribution centers?
- Which connections carry the most volume?
- How does the flow change from one quarter to the next?
Key features
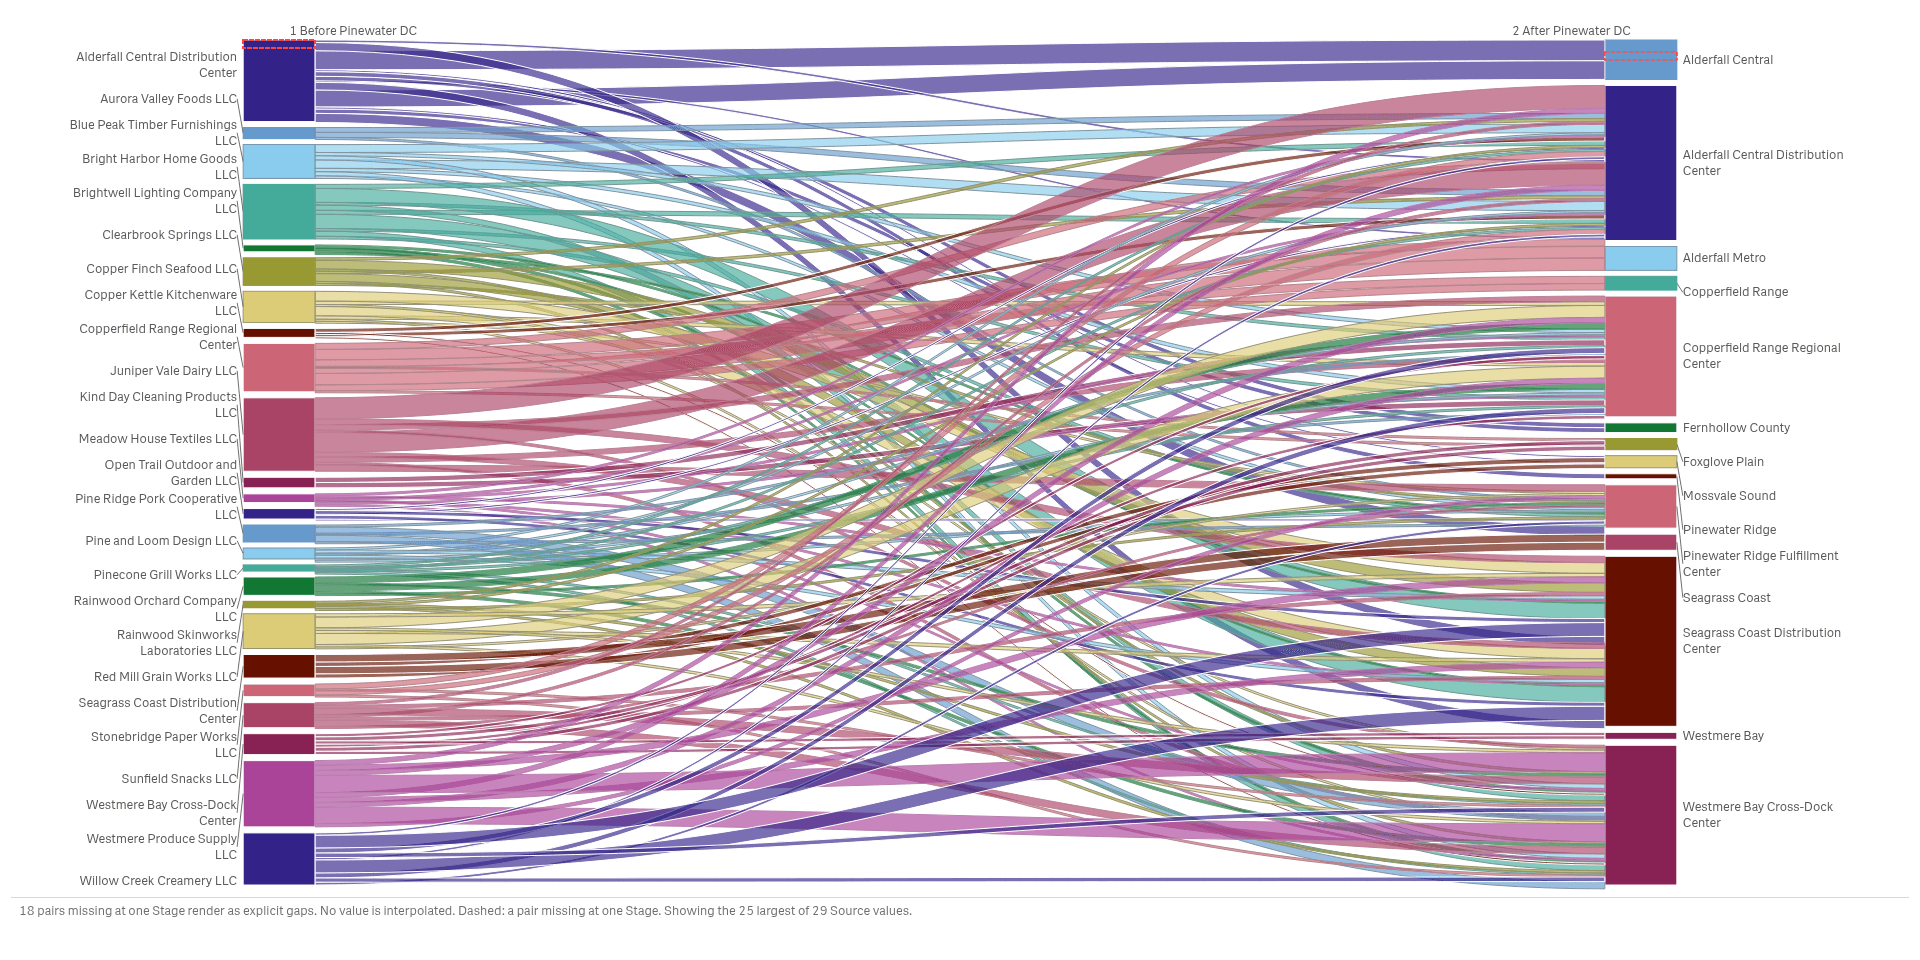
Follow the flow from one stage to the next
An alluvial diagram sends each supplier's volume to the sites that receive it, so shifts between stages show.
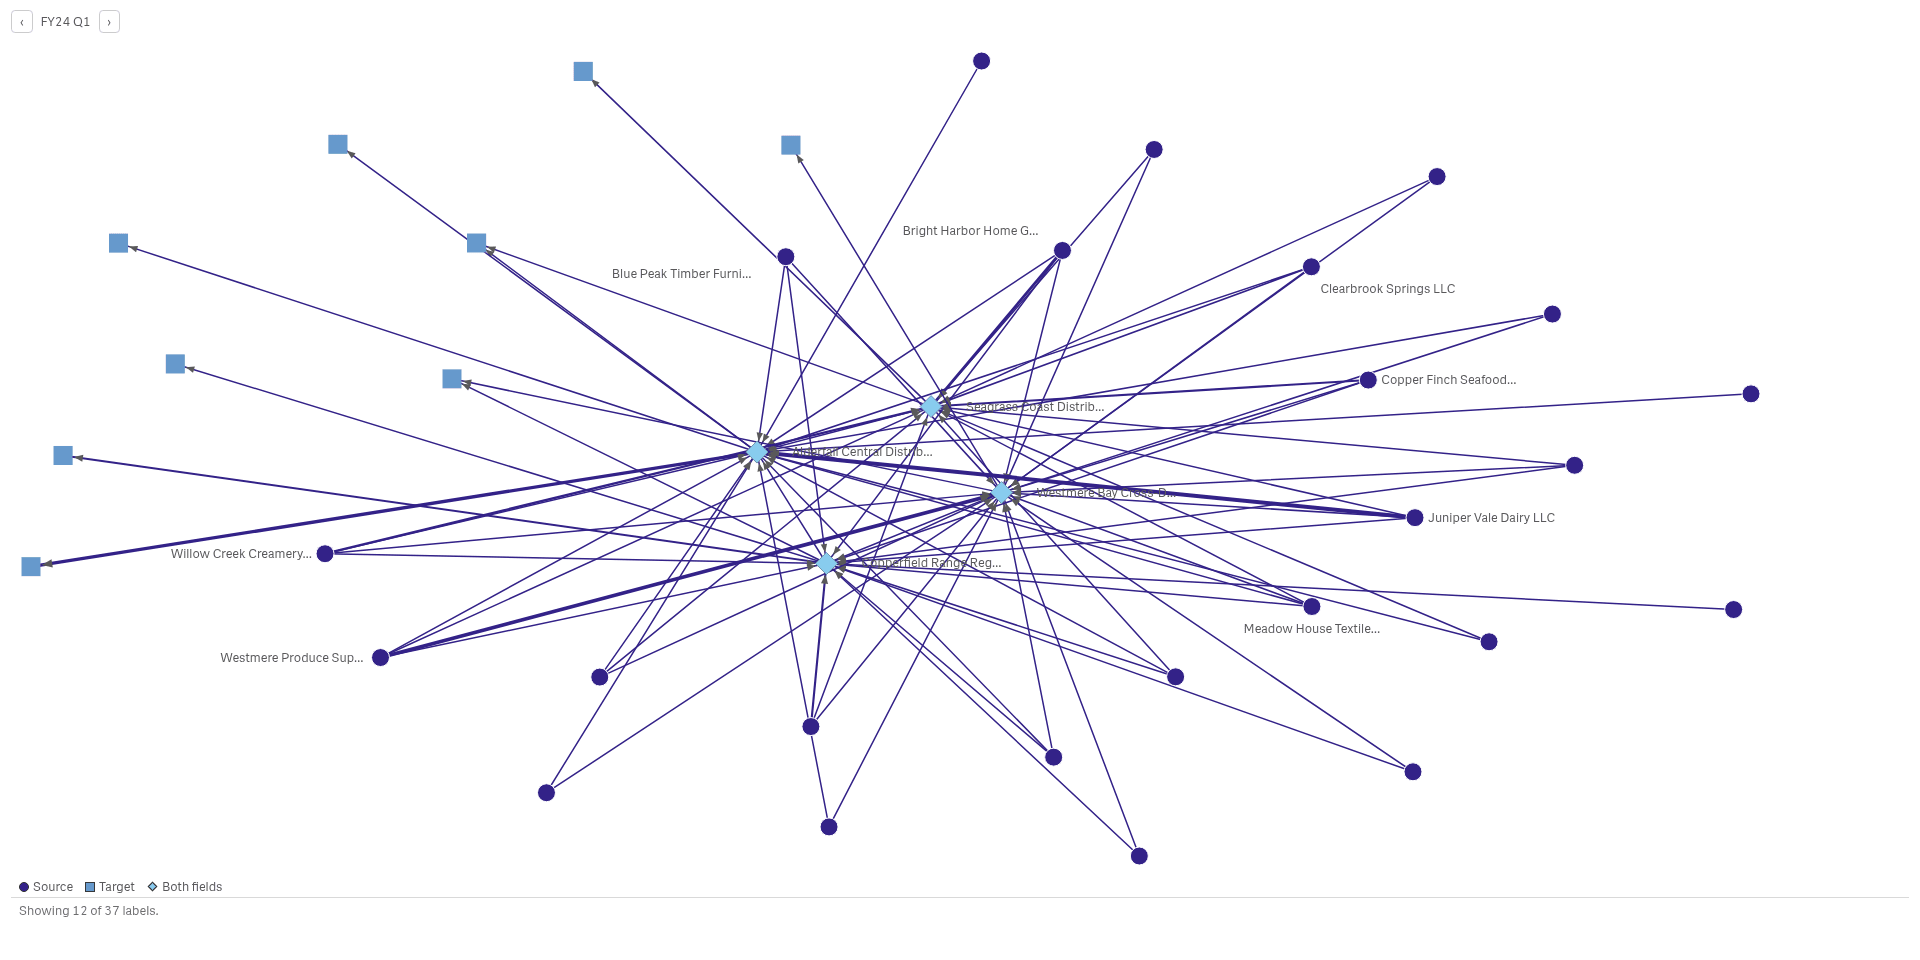
Find the hubs in a network
A network draws each party as a node and each link as a line, so busy hubs and lone nodes stand out.
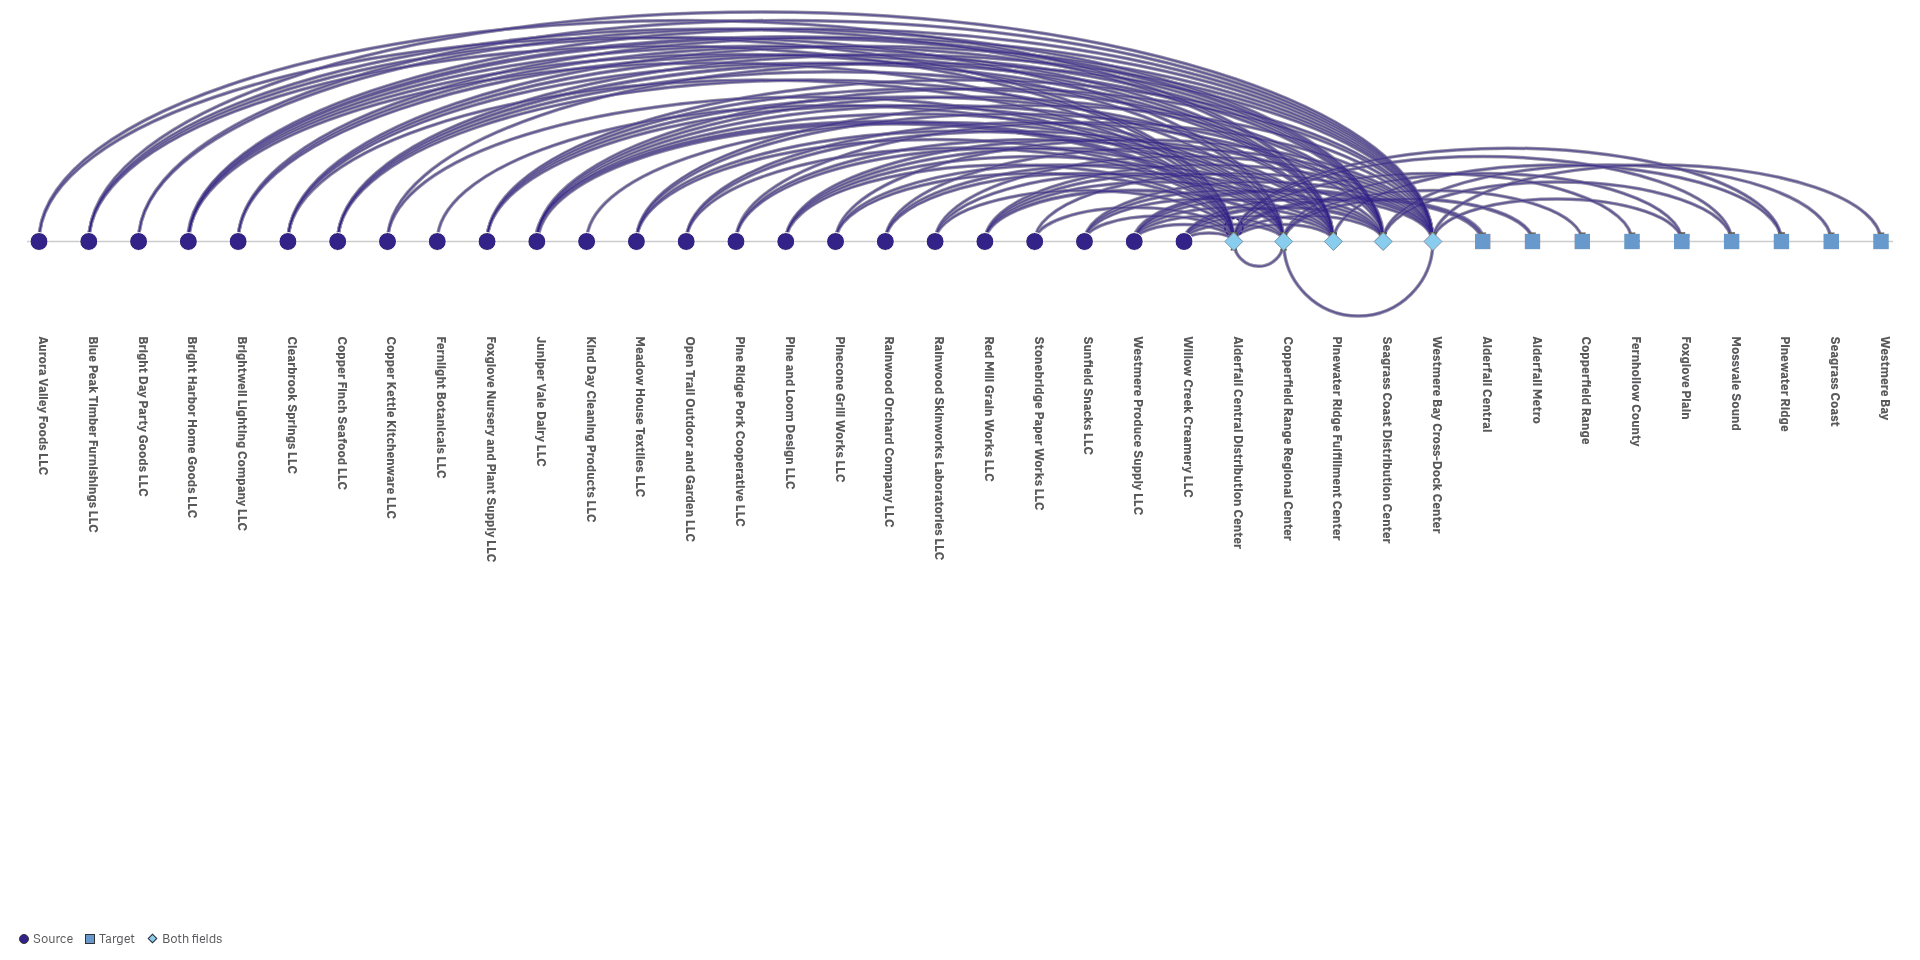
Read many links along one line
An arc diagram puts every party on one line and draws each link as an arc, so long and short links compare.
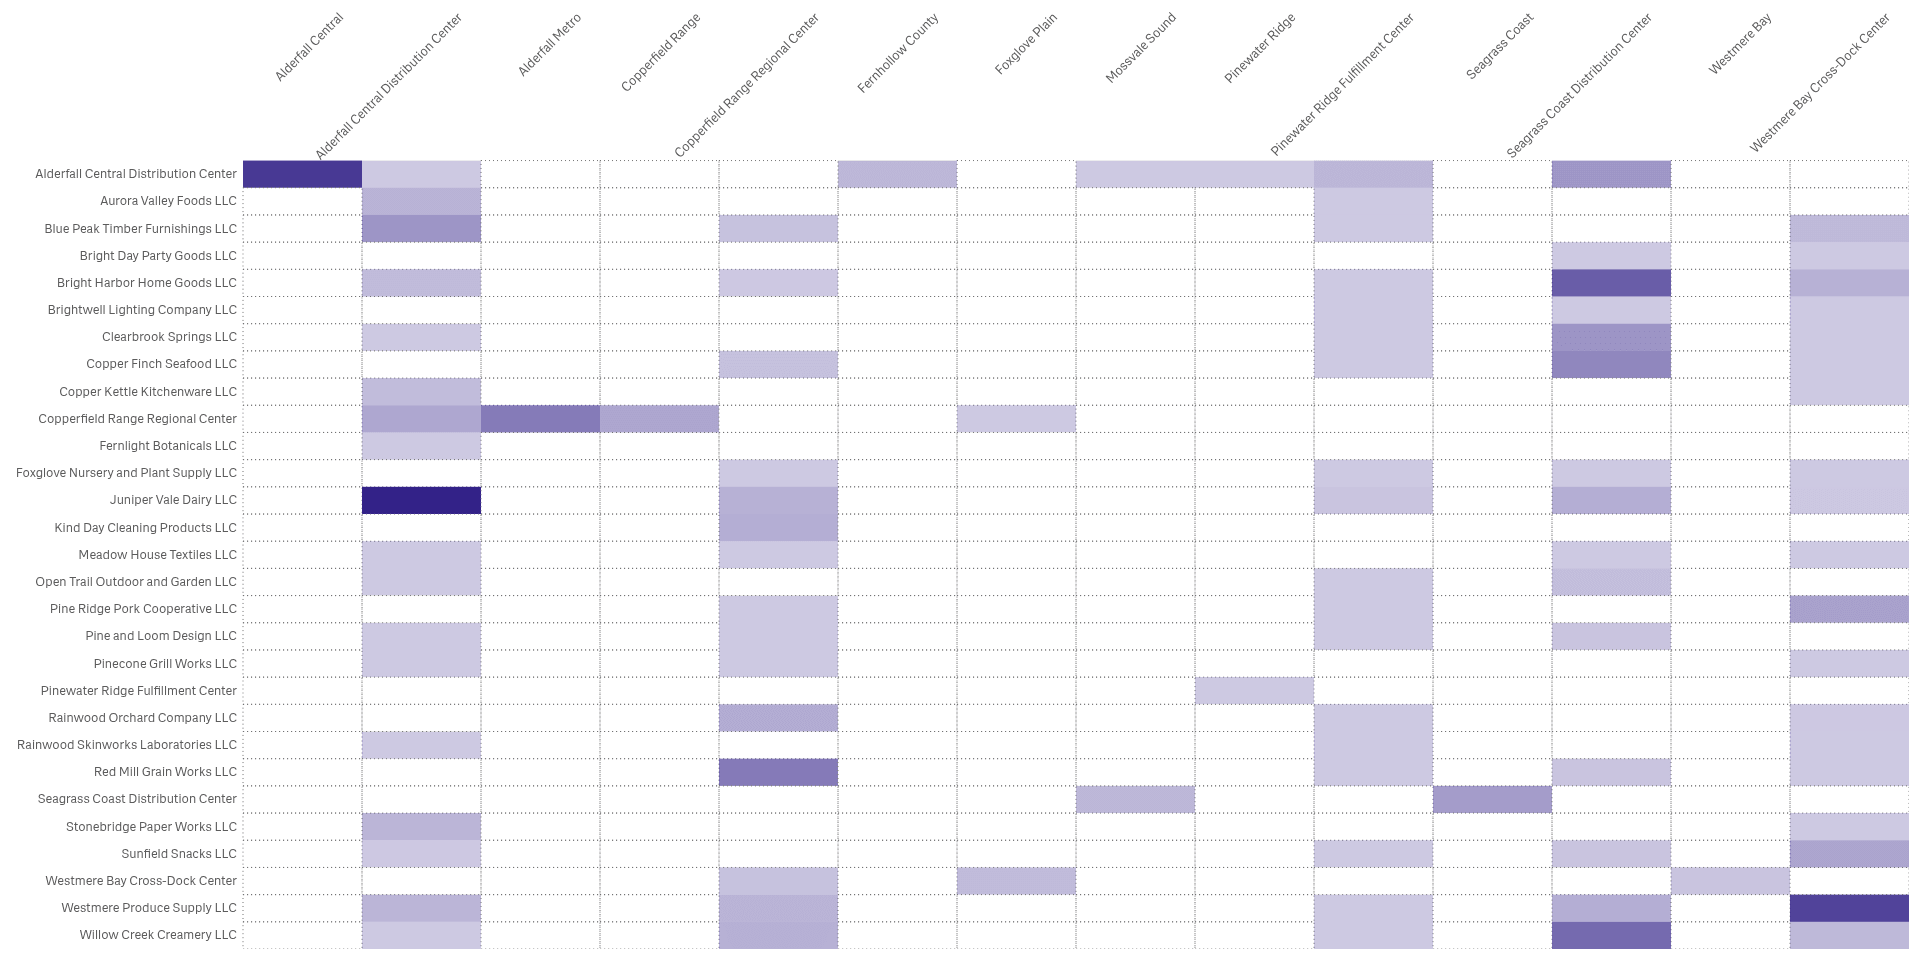
Look up any pair in a matrix
An adjacency matrix gives every pair its own cell, so dense and empty areas show without any overlap.
See it working
 View full size
 View full size
Try it
Download
Version 2.1.6
Extension
Demo App
Release page on GitHub with every file and its checksum.
Install
Install an extension in Qlik Cloud or client-managed Qlik Sense.
Set up
Install notes
No install notes for this Product. See the general install page.
Docs
Release notes
No release notes yet.
How to get a license
- Review the Product Listing and its documentation.
- E-mail us the Product name, the name of your Qlik Cloud tenant and the number of users.
- We reply to you with the next step.