
Tm Visualization Suite: Spatial Explorer
Where do things happen, and where do they cluster?
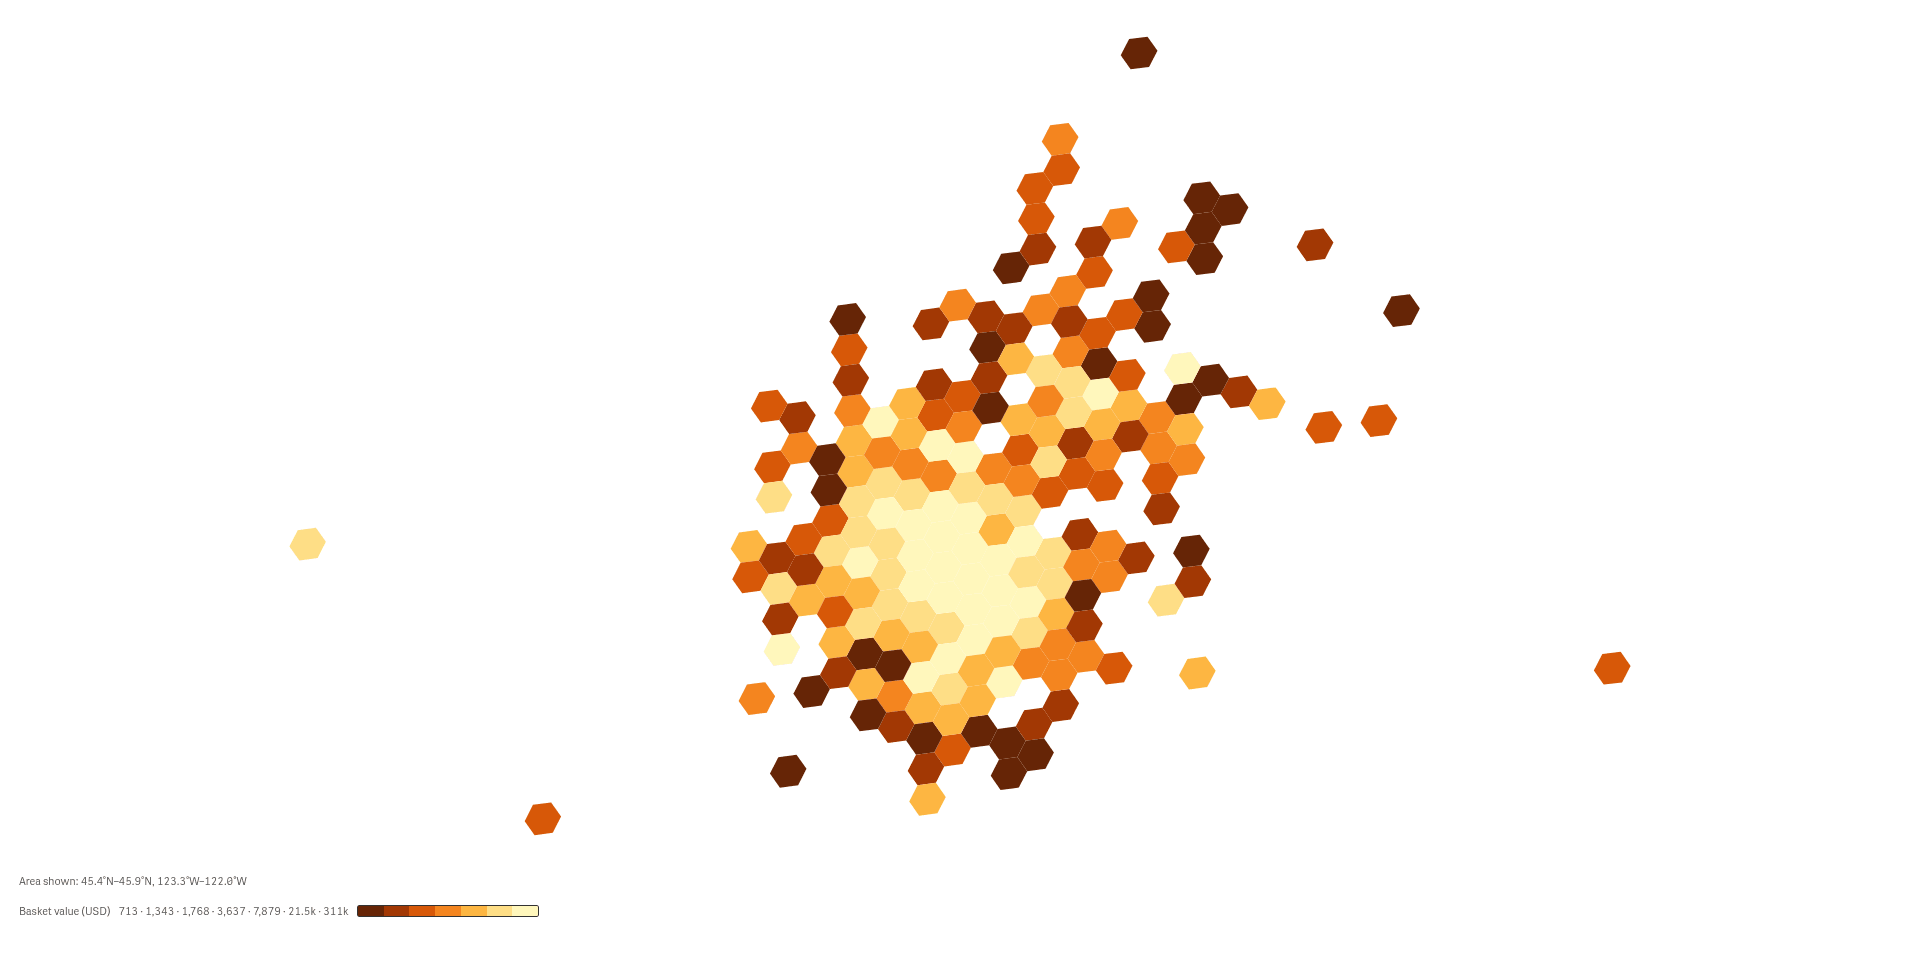 View full size
Version 2.1.6 · released 2026-11-03
See where orders and activity cluster on a map, from a regional overview down to single locations.
What it does
Tm Visualization Suite: Spatial Explorer puts locations on a map inside your Qlik app. Many points are grouped into hexagonal cells that are coloured by a measure, so you see density and hot spots at a glance. You choose how fine the cells are, from a few large regions to cells the size of a town.
Click a cell to select the locations behind it, and the rest of the sheet follows. The map reads your data and never changes it. The map shows the area you look at, and a note under it says how many locations that area holds.
Analysts and BI leads who study where customers, orders or events are located.
Good for
- Where do our orders come from?
- Which areas order the most, and which are quiet?
- How fine can I look before the pattern breaks up?
Key features
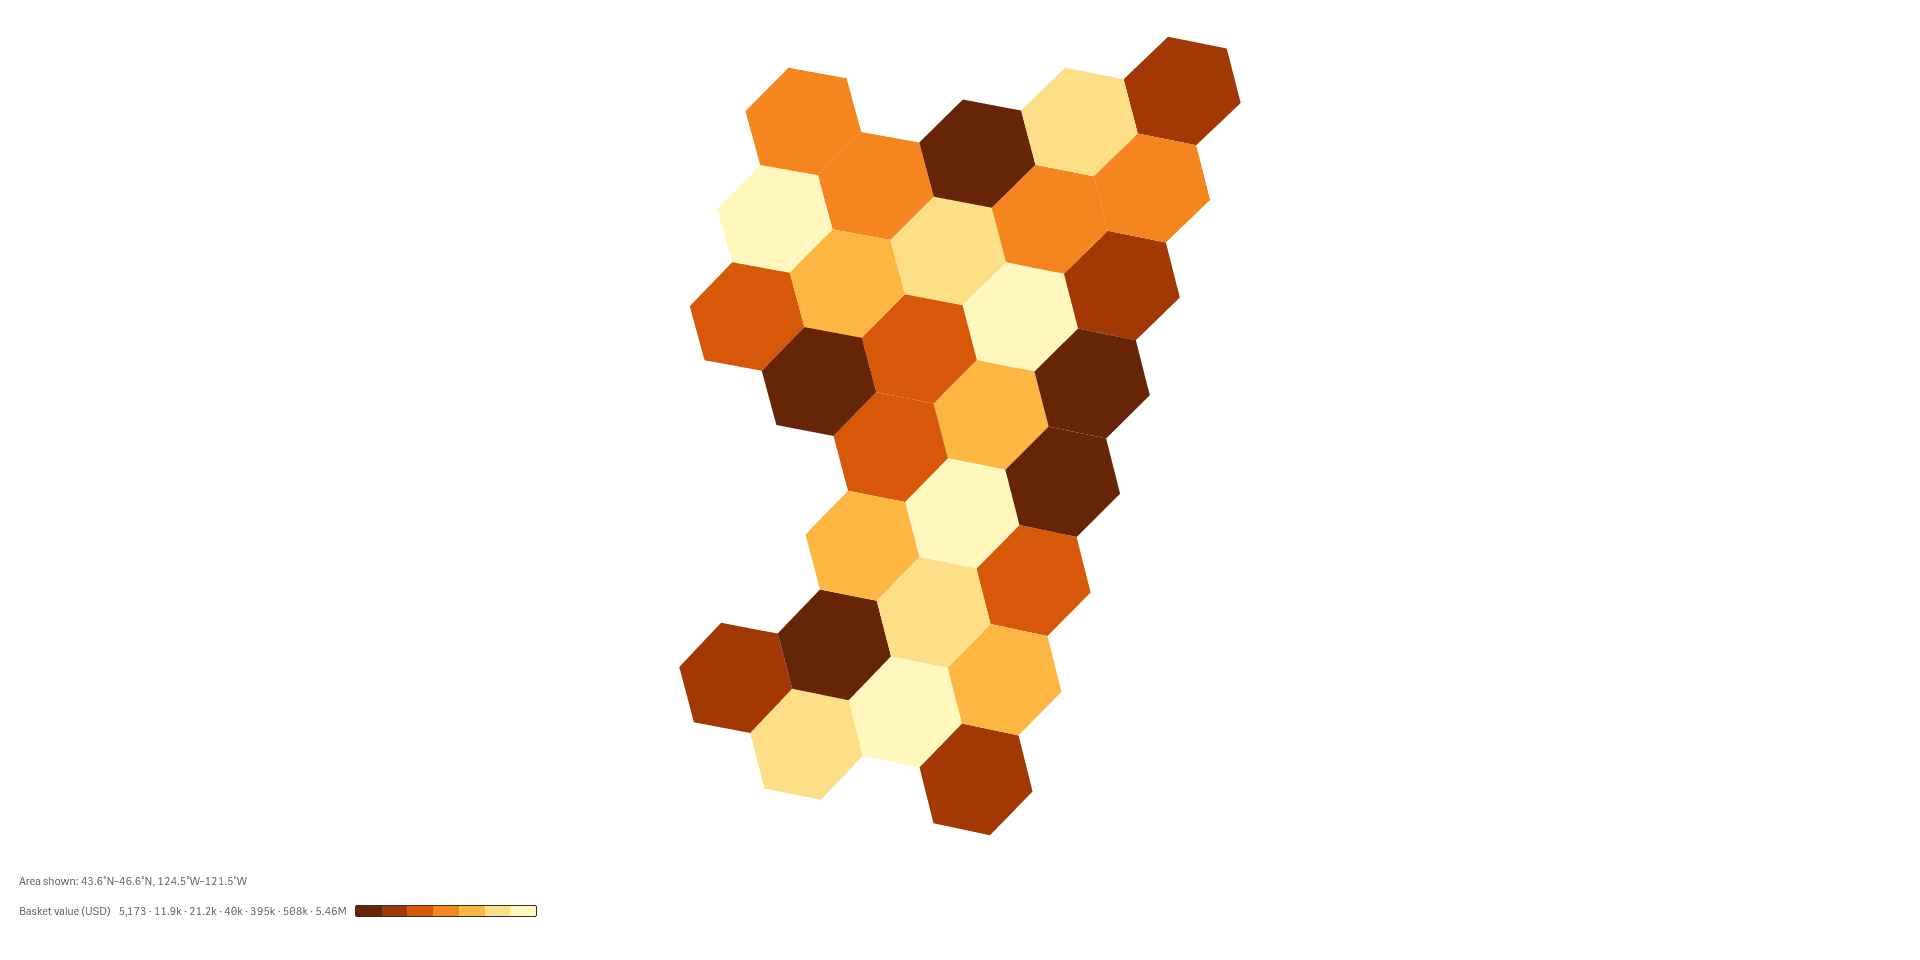
Start with a regional overview
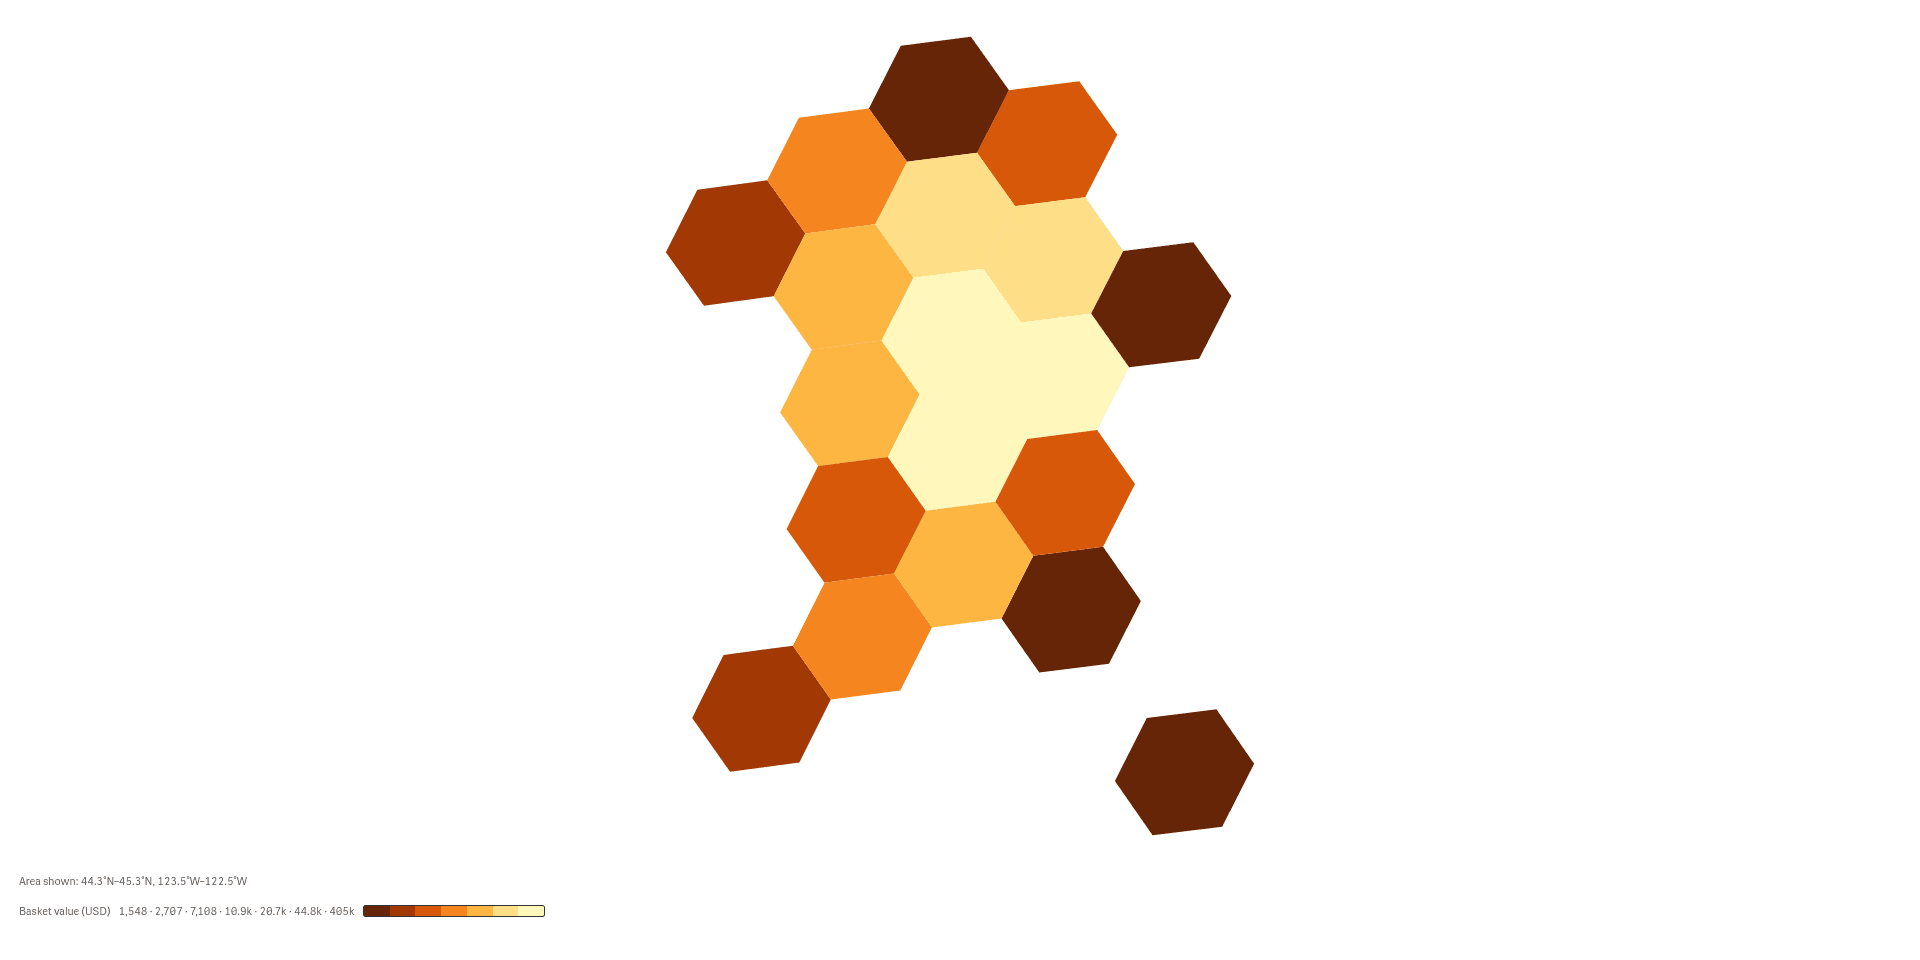
Large cells give the big picture, so you see which parts of the map carry the most value.
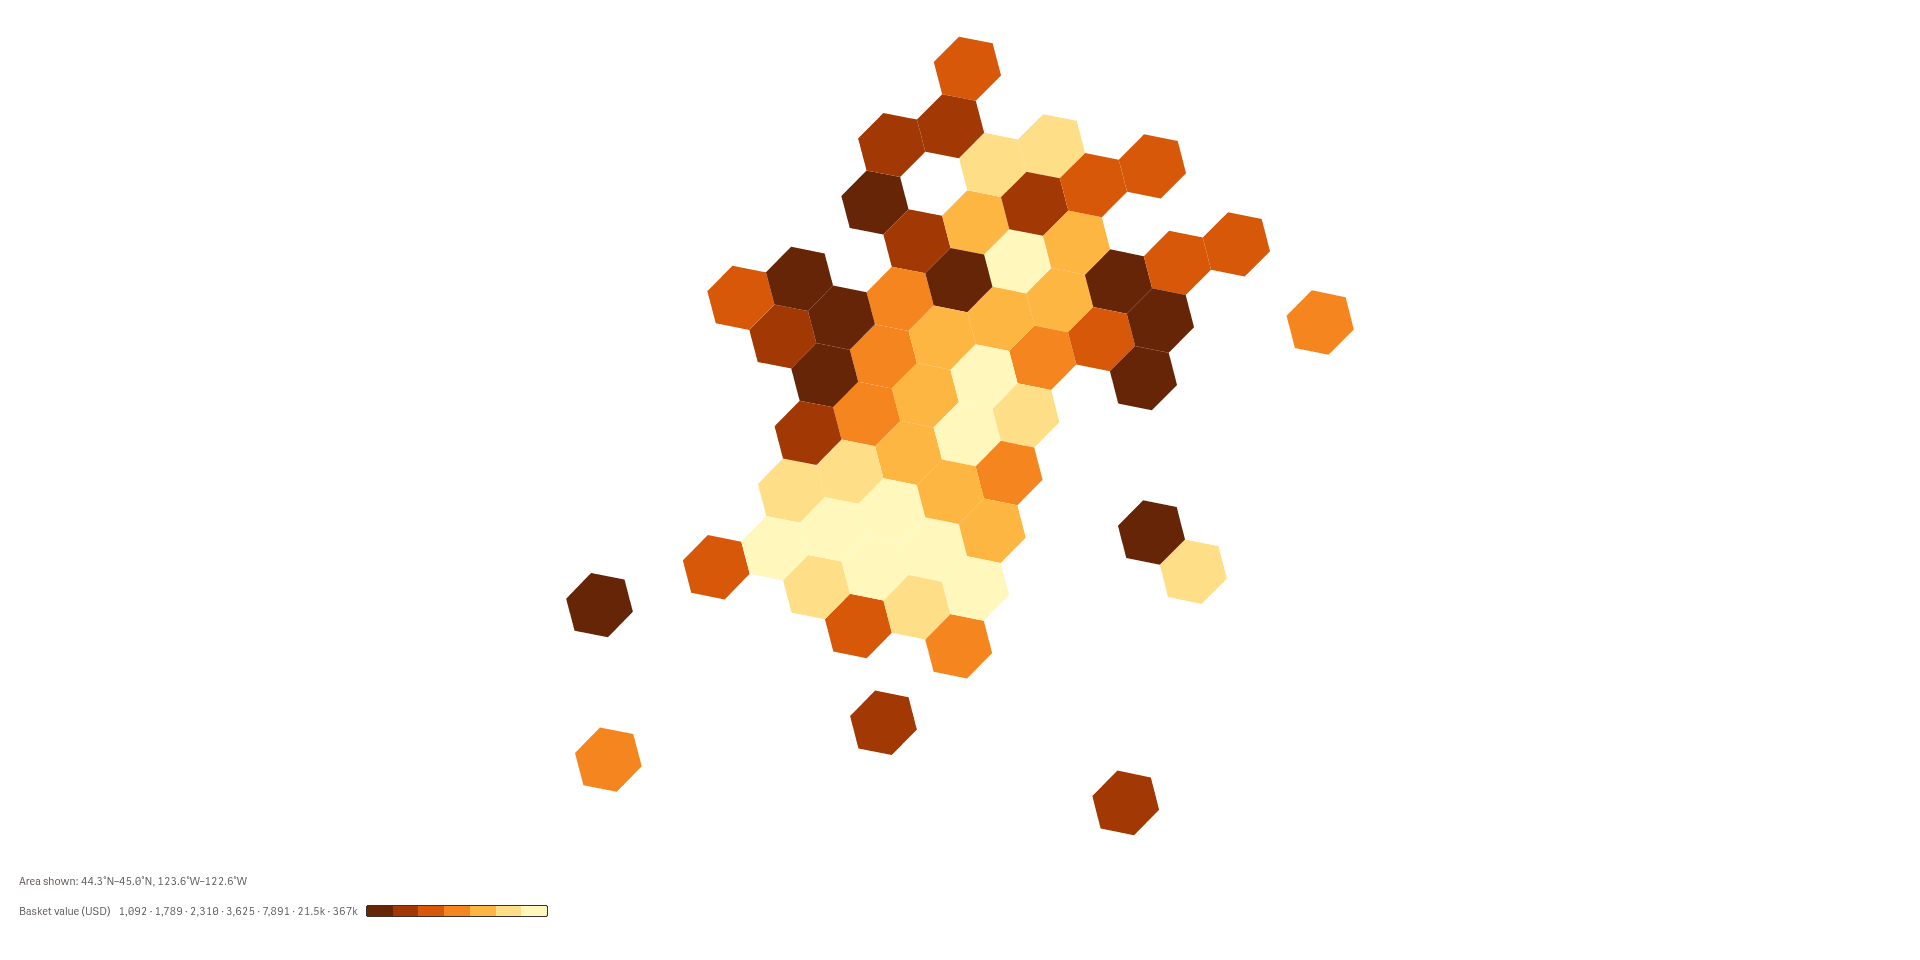
Zoom in without losing the pattern
Smaller cells split the regions, so the busy areas show up inside them.
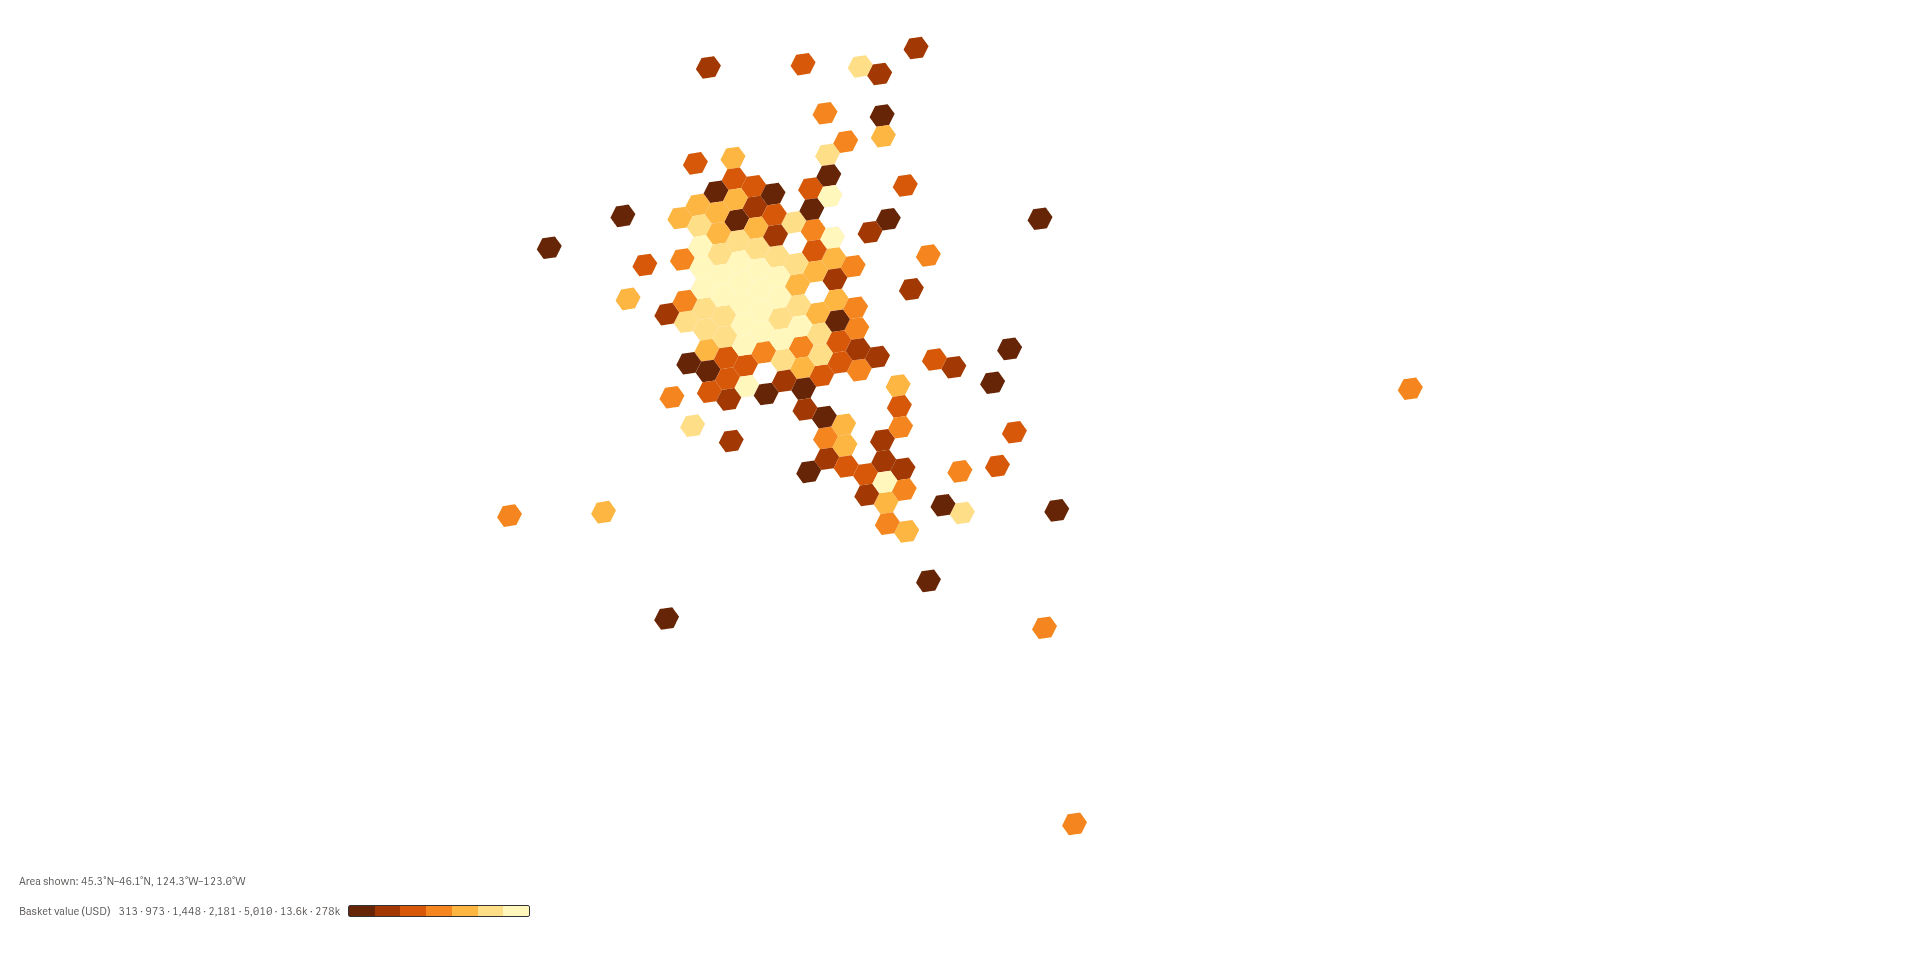
See how a town spreads out
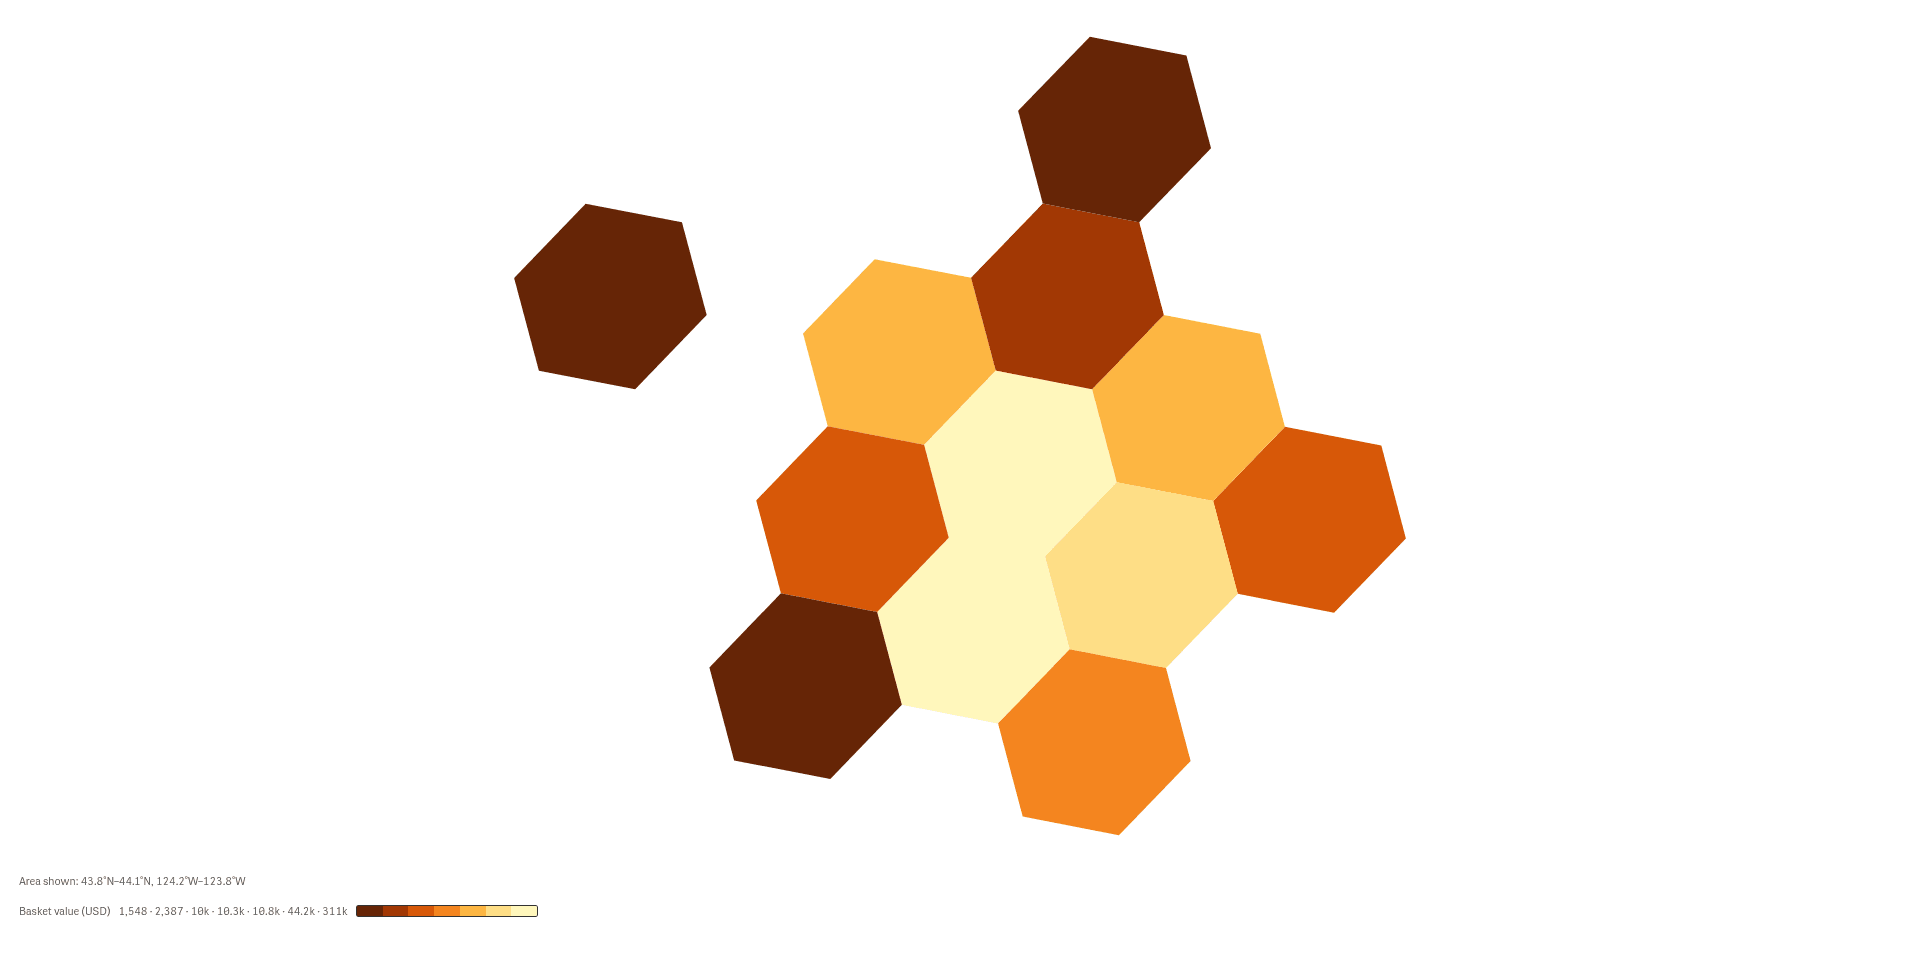
Fine cells show how orders spread inside a town and where the edge of the cluster falls.
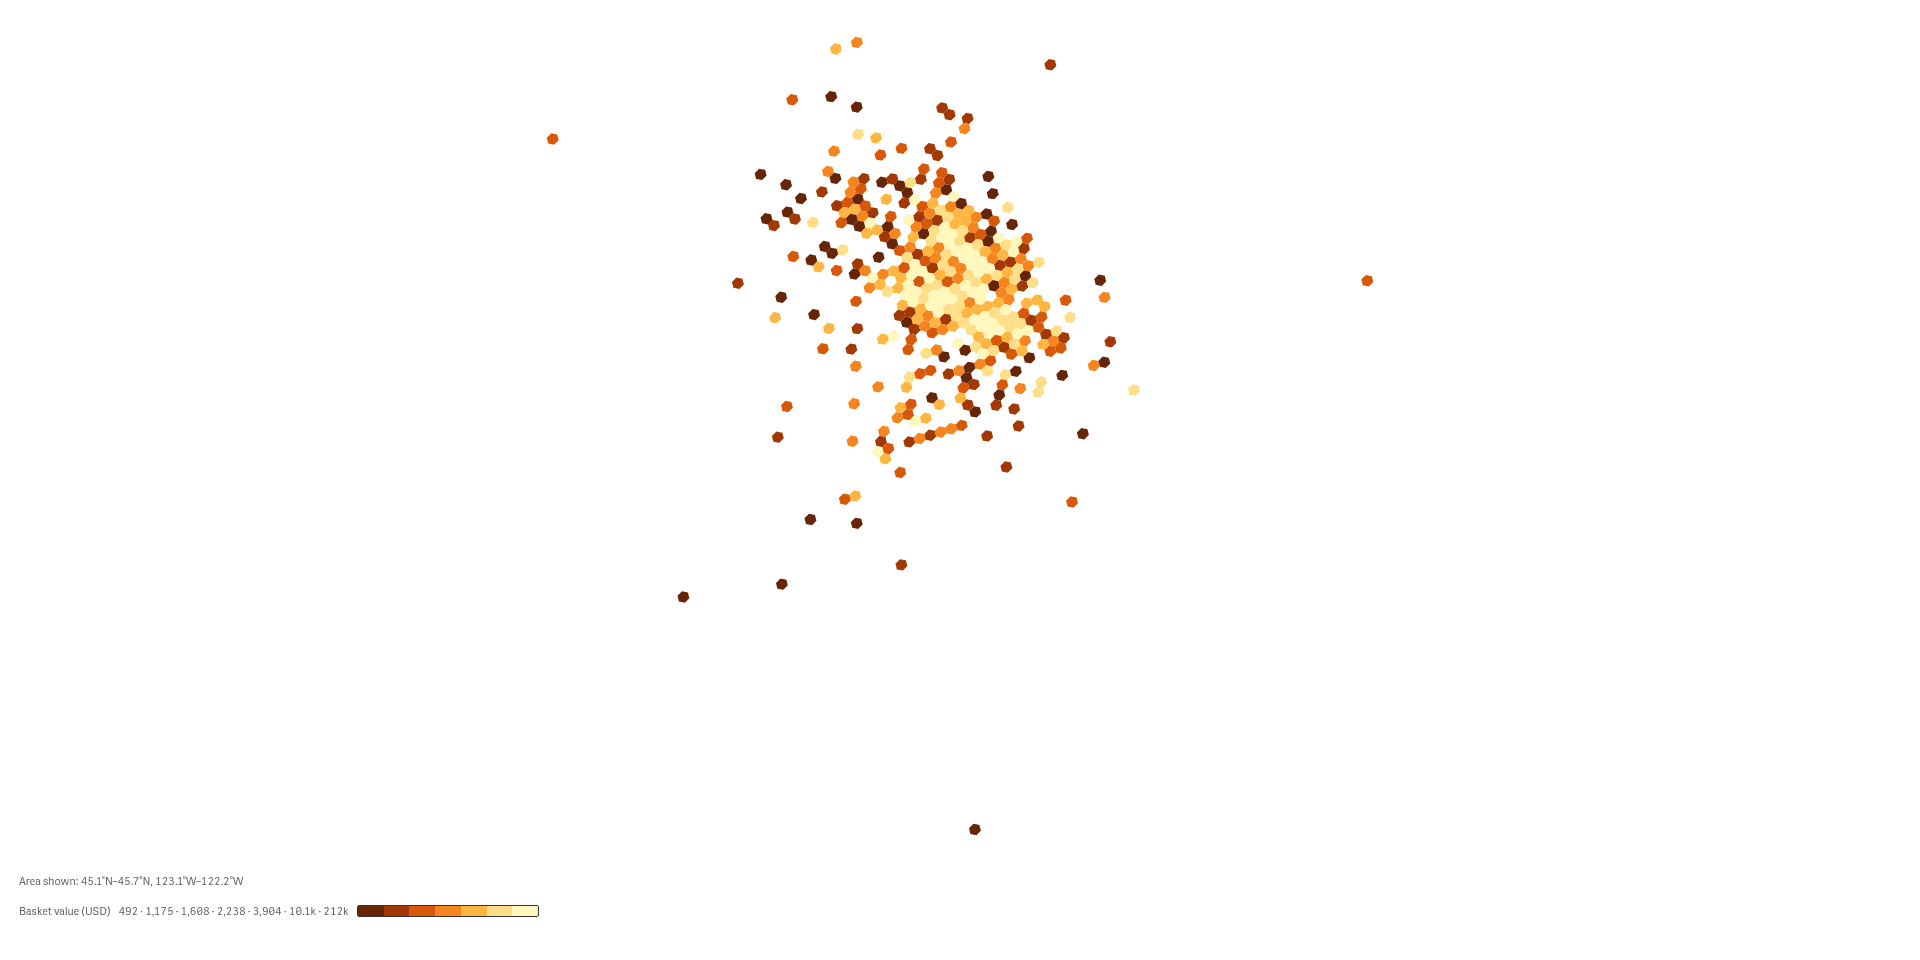
Go down to single locations
The finest setting draws nearly every delivery location, so outliers outside the cluster stand out.
See it working
 View full size
 View full size
Try it
Download
Version 2.1.6
Extension
Demo App
Release page on GitHub with every file and its checksum.
Install
Install an extension in Qlik Cloud or client-managed Qlik Sense.
Set up
Install notes
No install notes for this Product. See the general install page.
Docs
Release notes
No release notes yet.
How to get a license
- Review the Product Listing and its documentation.
- E-mail us the Product name, the name of your Qlik Cloud tenant and the number of users.
- We reply to you with the next step.