
Tm Visualization Suite: Temporal Patterns
When do things happen, and how do the patterns repeat over time?
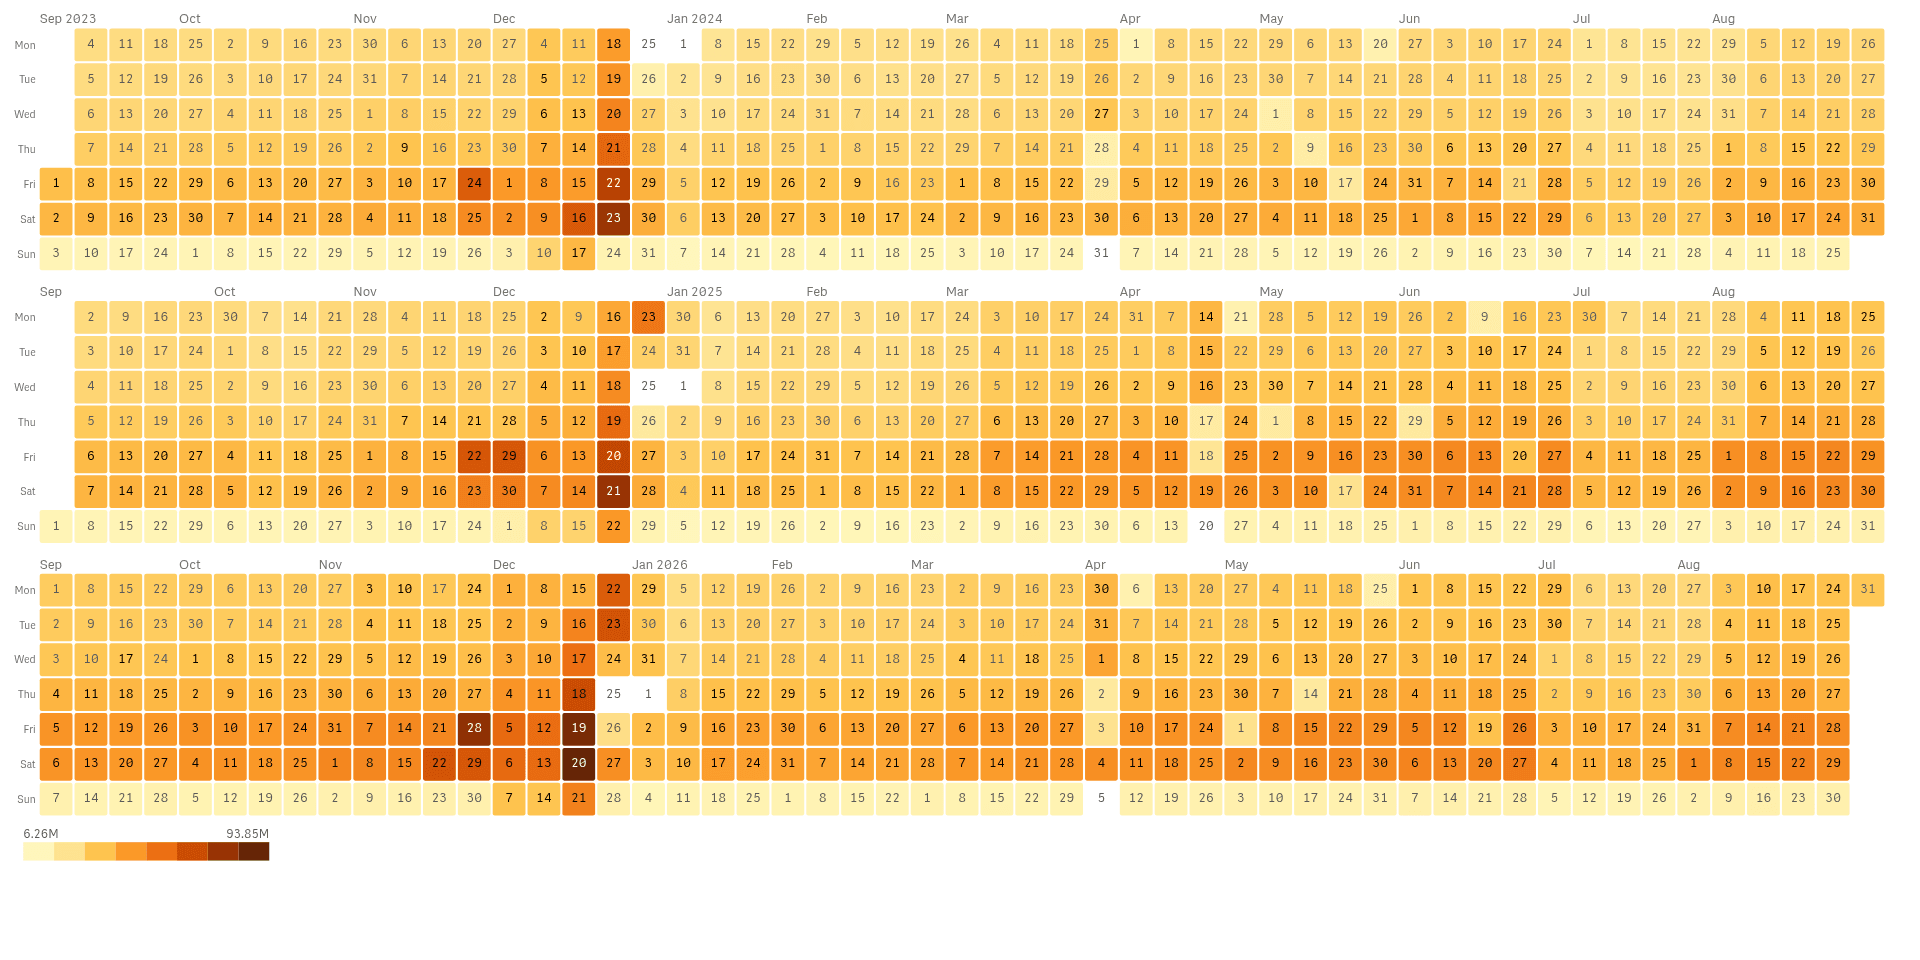 View full size
Version 2.1.6 · released 2026-11-03
See daily rhythm, seasons and trends in one view, and spot the days that break the pattern.
What it does
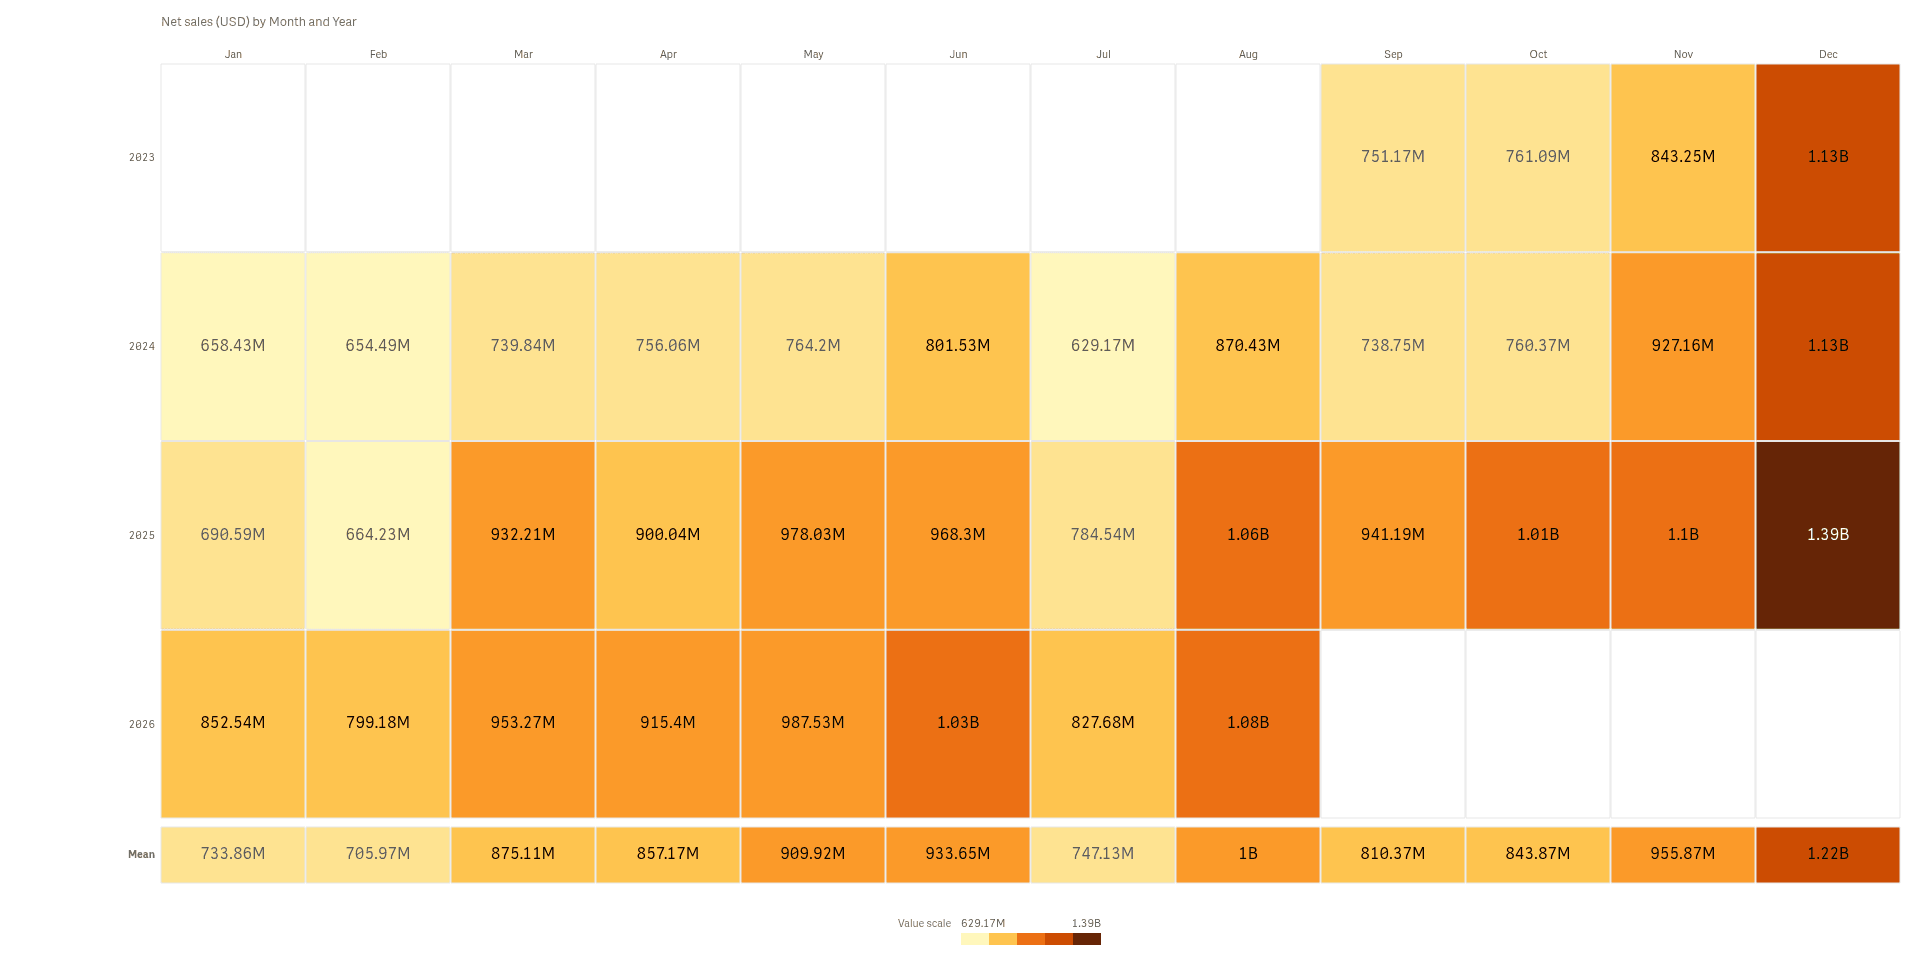
Tm Visualization Suite: Temporal Patterns turns a column of dates and one number into six views of time: a calendar heatmap, ridgelines, horizon bands, a yearly cycle, a streamgraph and a seasonal heatmap. Each makes a different pattern easy to see, such as busy weekdays, a seasonal peak or a slow rise.
Click a day, week or band to select the dates behind it, and the rest of the sheet follows. The charts read your data and never change it. Very long date ranges are summed into weeks, and a note says so.
Analysts and BI leads who look for rhythm, seasons and trends in sales or activity over time.
Good for
- Which weekdays and months are busiest?
- How do regions compare across the same years?
- Which categories grow or fade over the seasons?
Key features
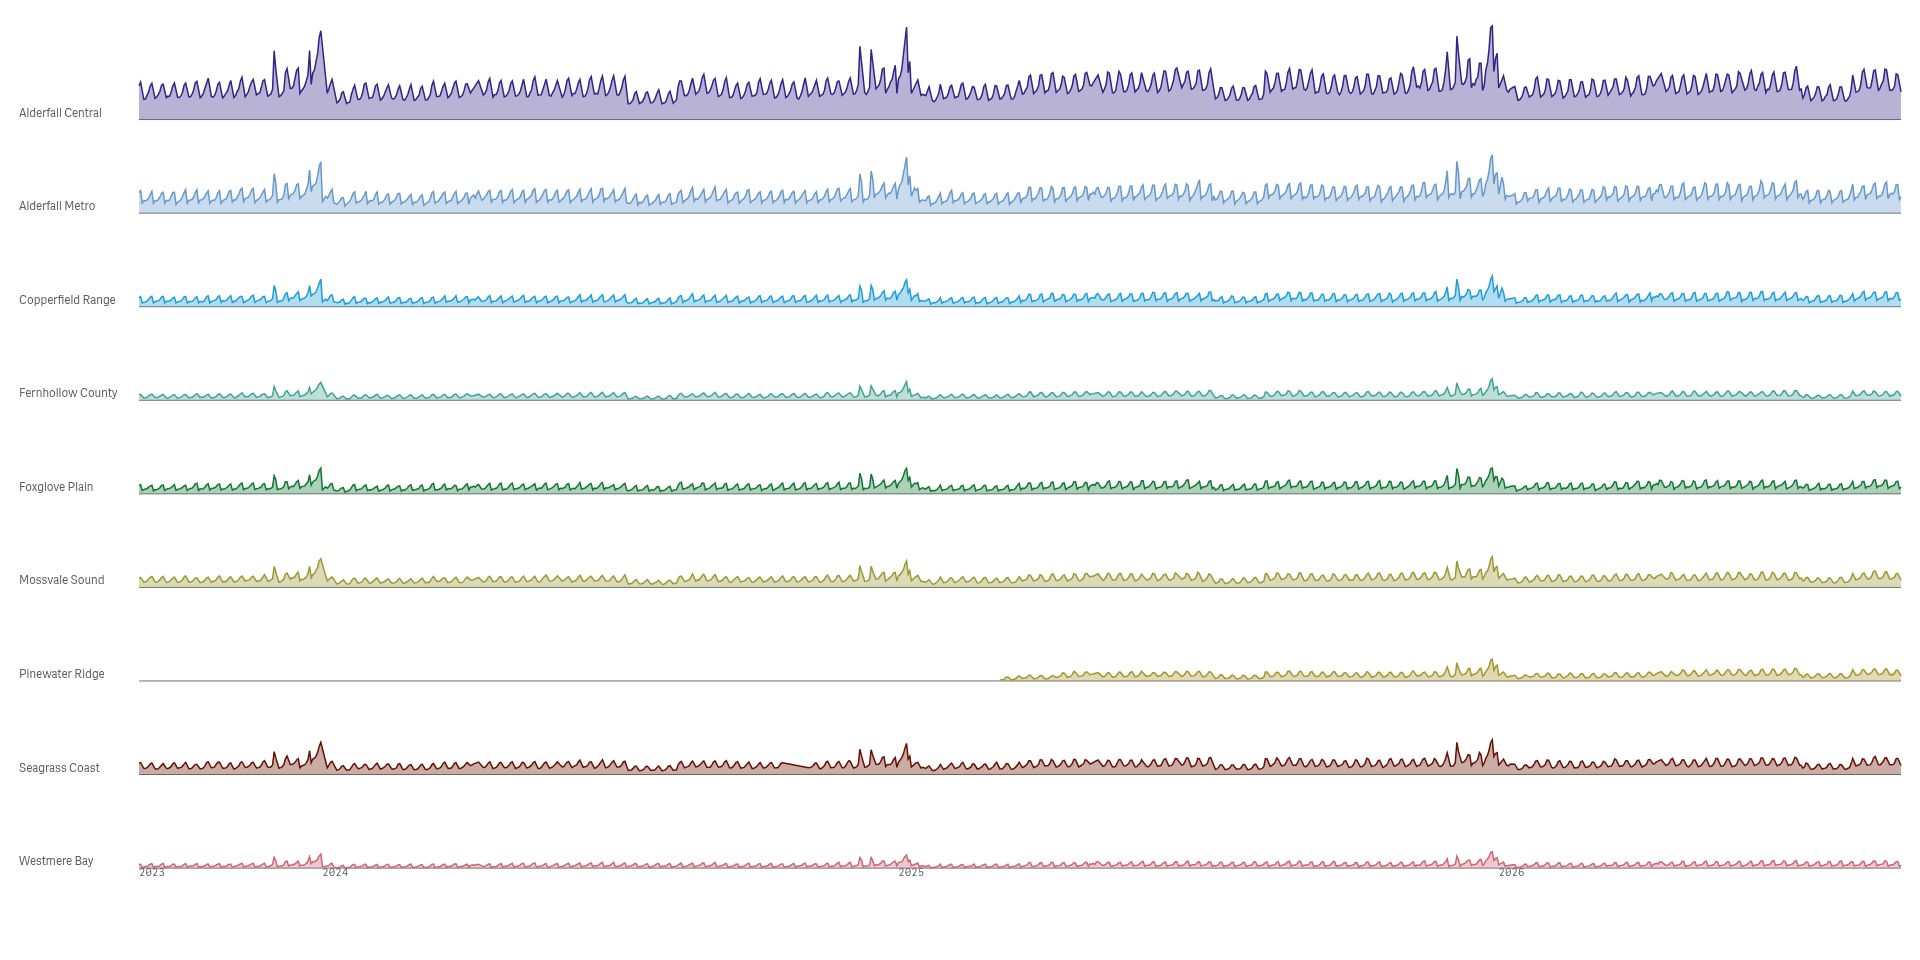
Compare many series on one rhythm
Ridgelines stack one small trend per group, so you can compare their shape and timing at a glance.
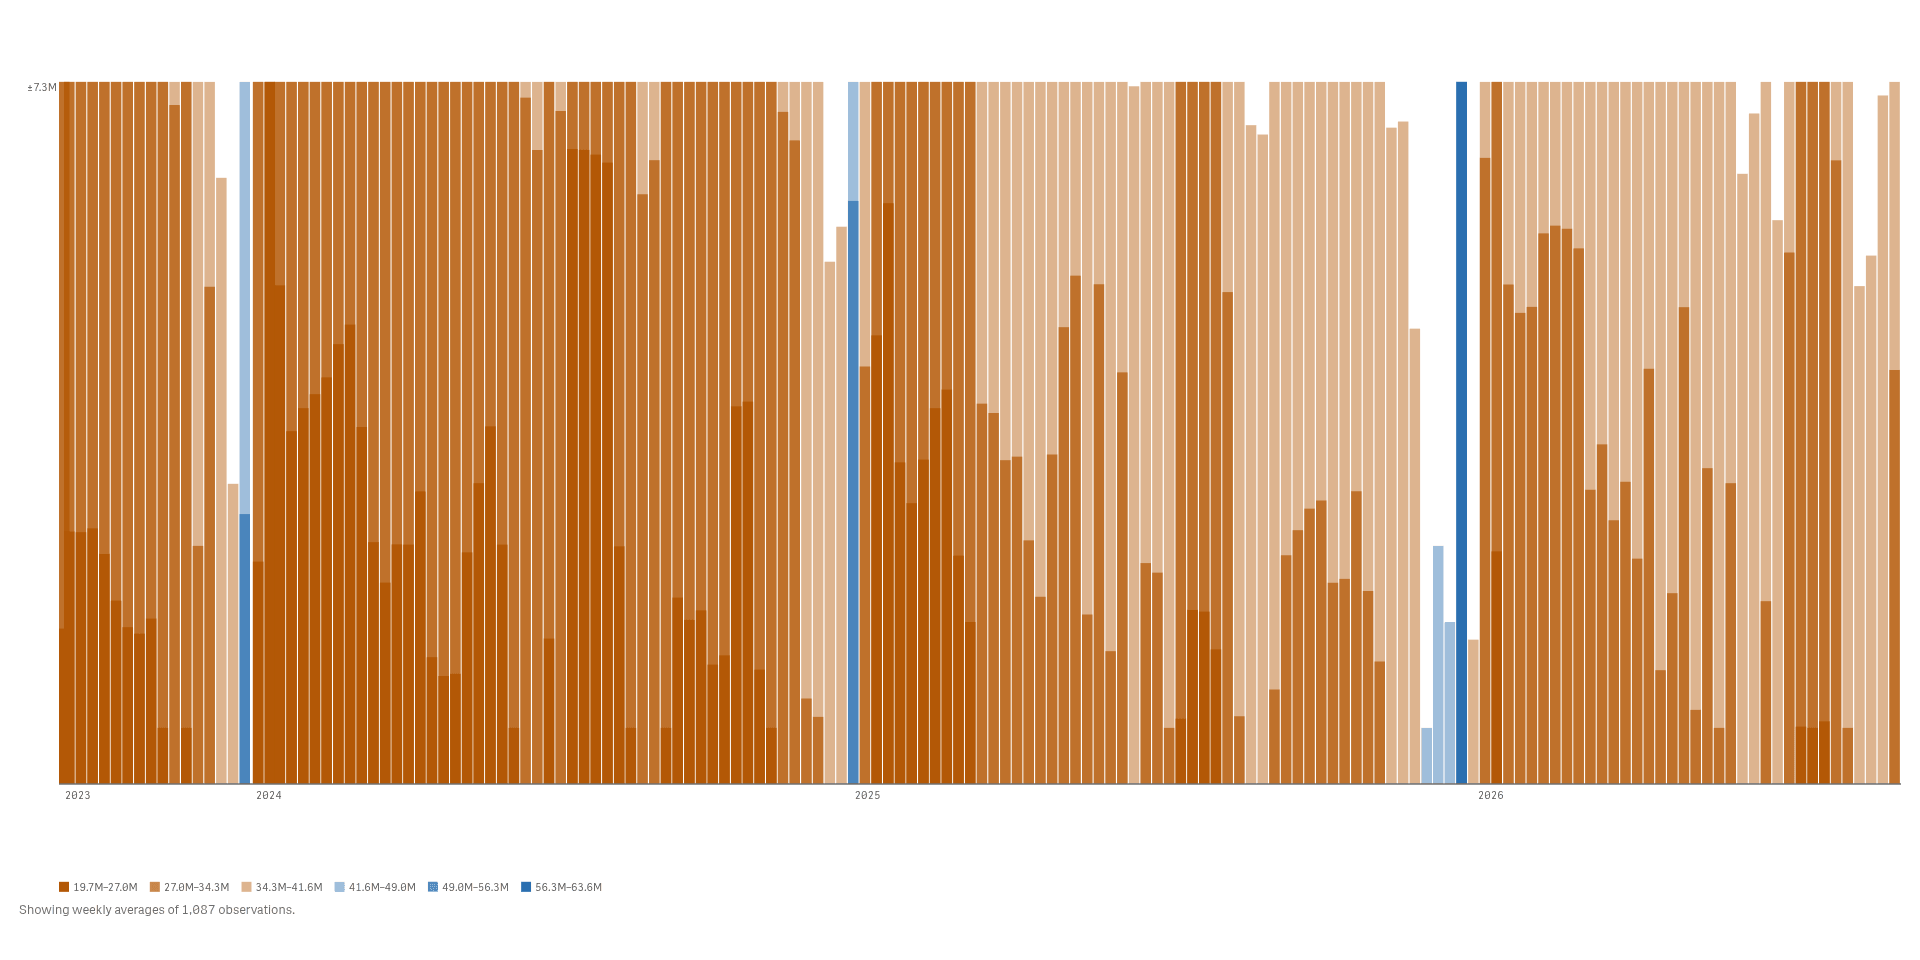
Pack a long series into a small space
Horizon bands fold a long series into bands of colour, so many weeks fit in one slim strip.
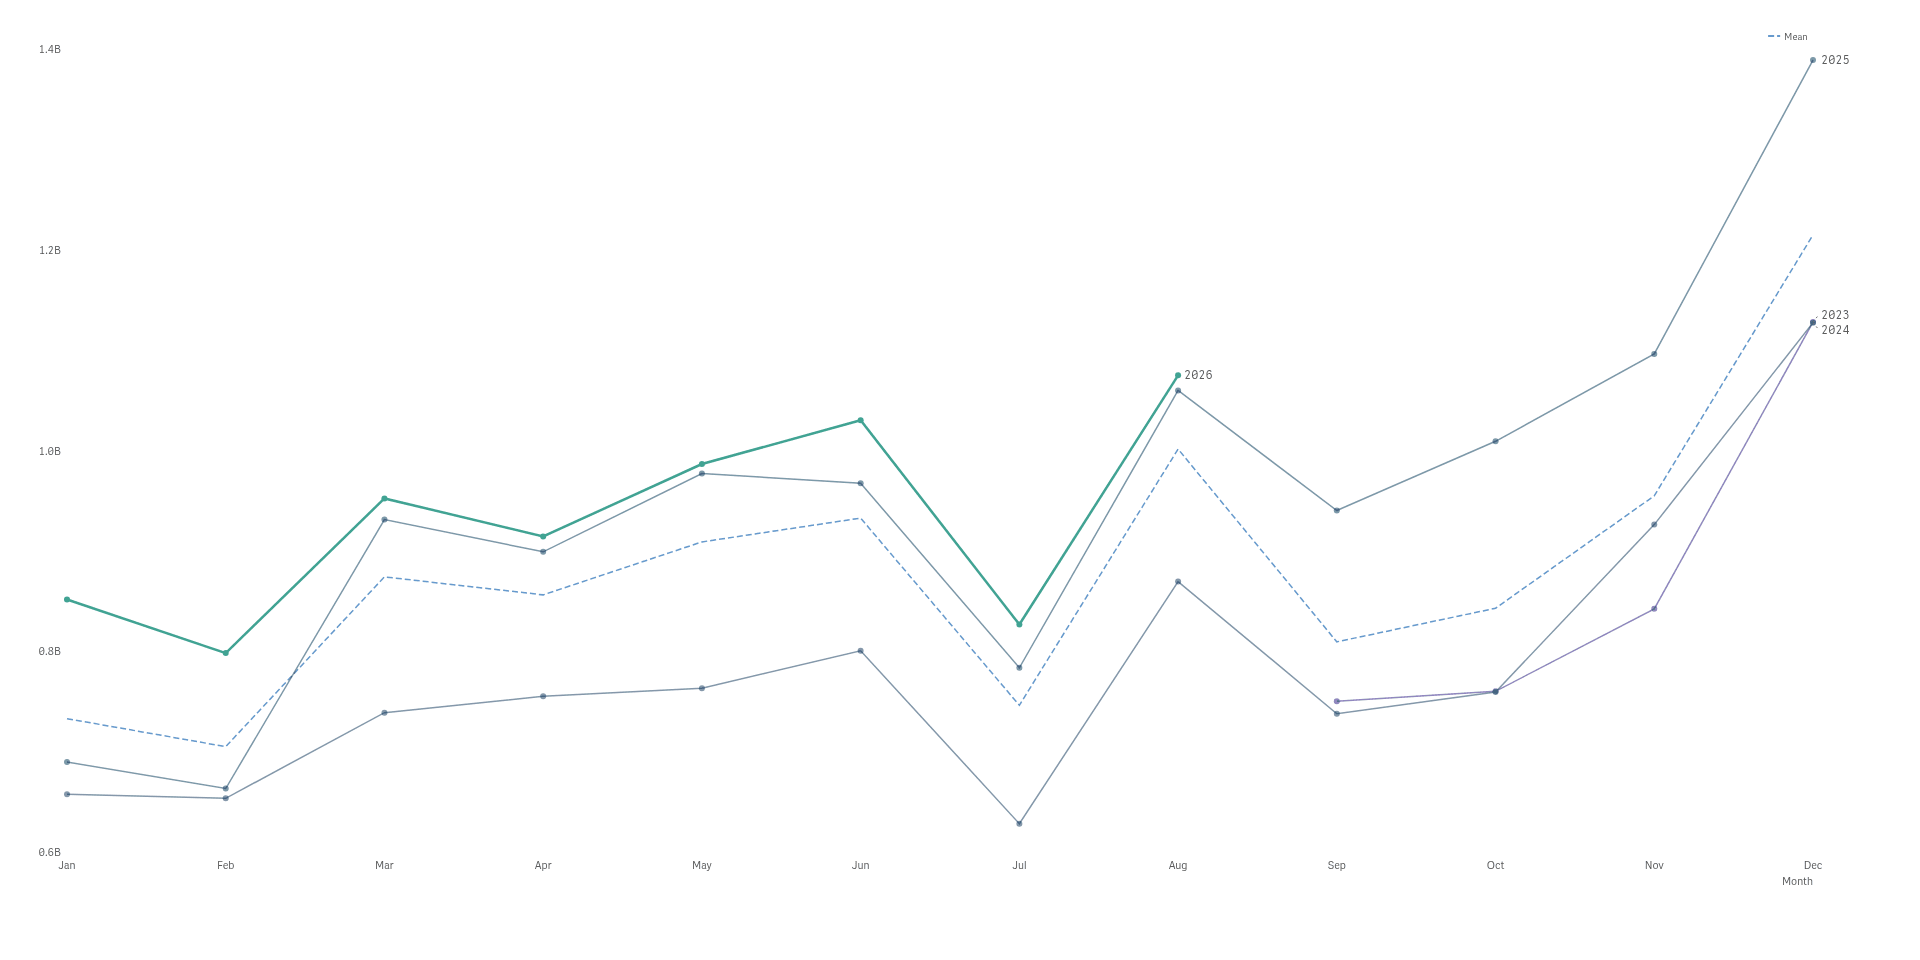
Lay the years on top of each other
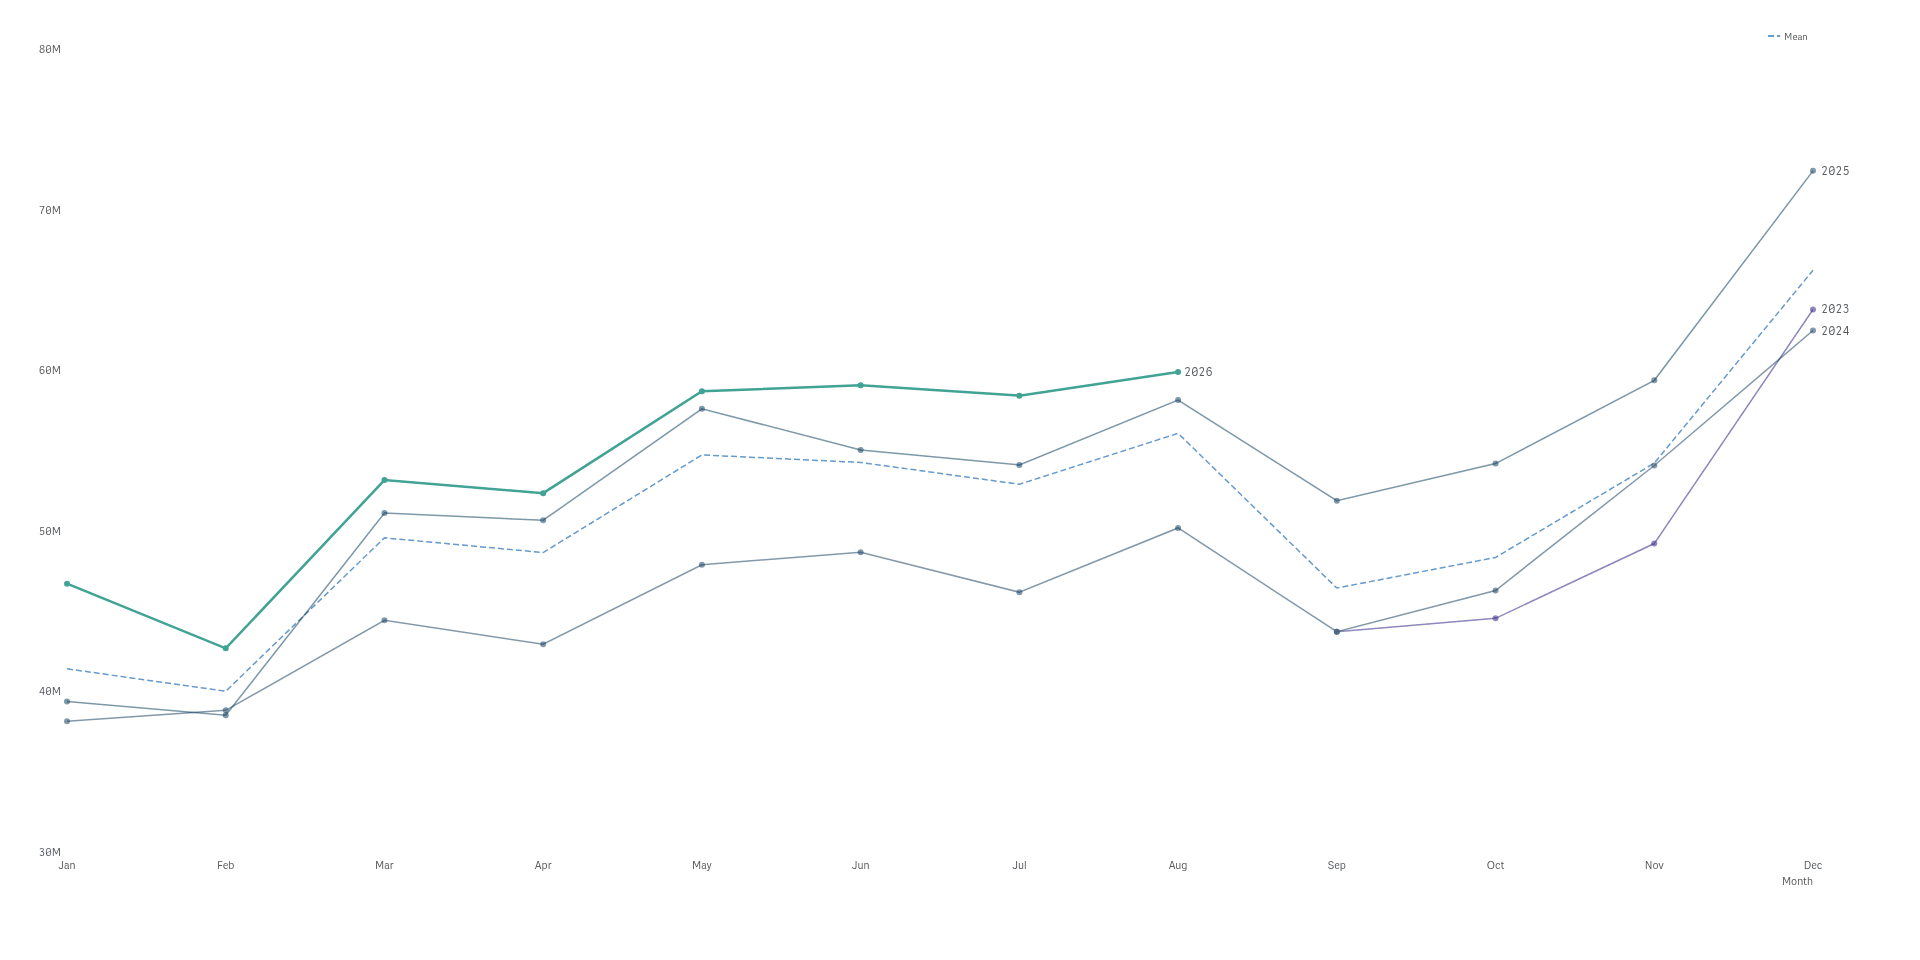
A cycle plot draws one line per year over the same months, so you see the season and the trend.
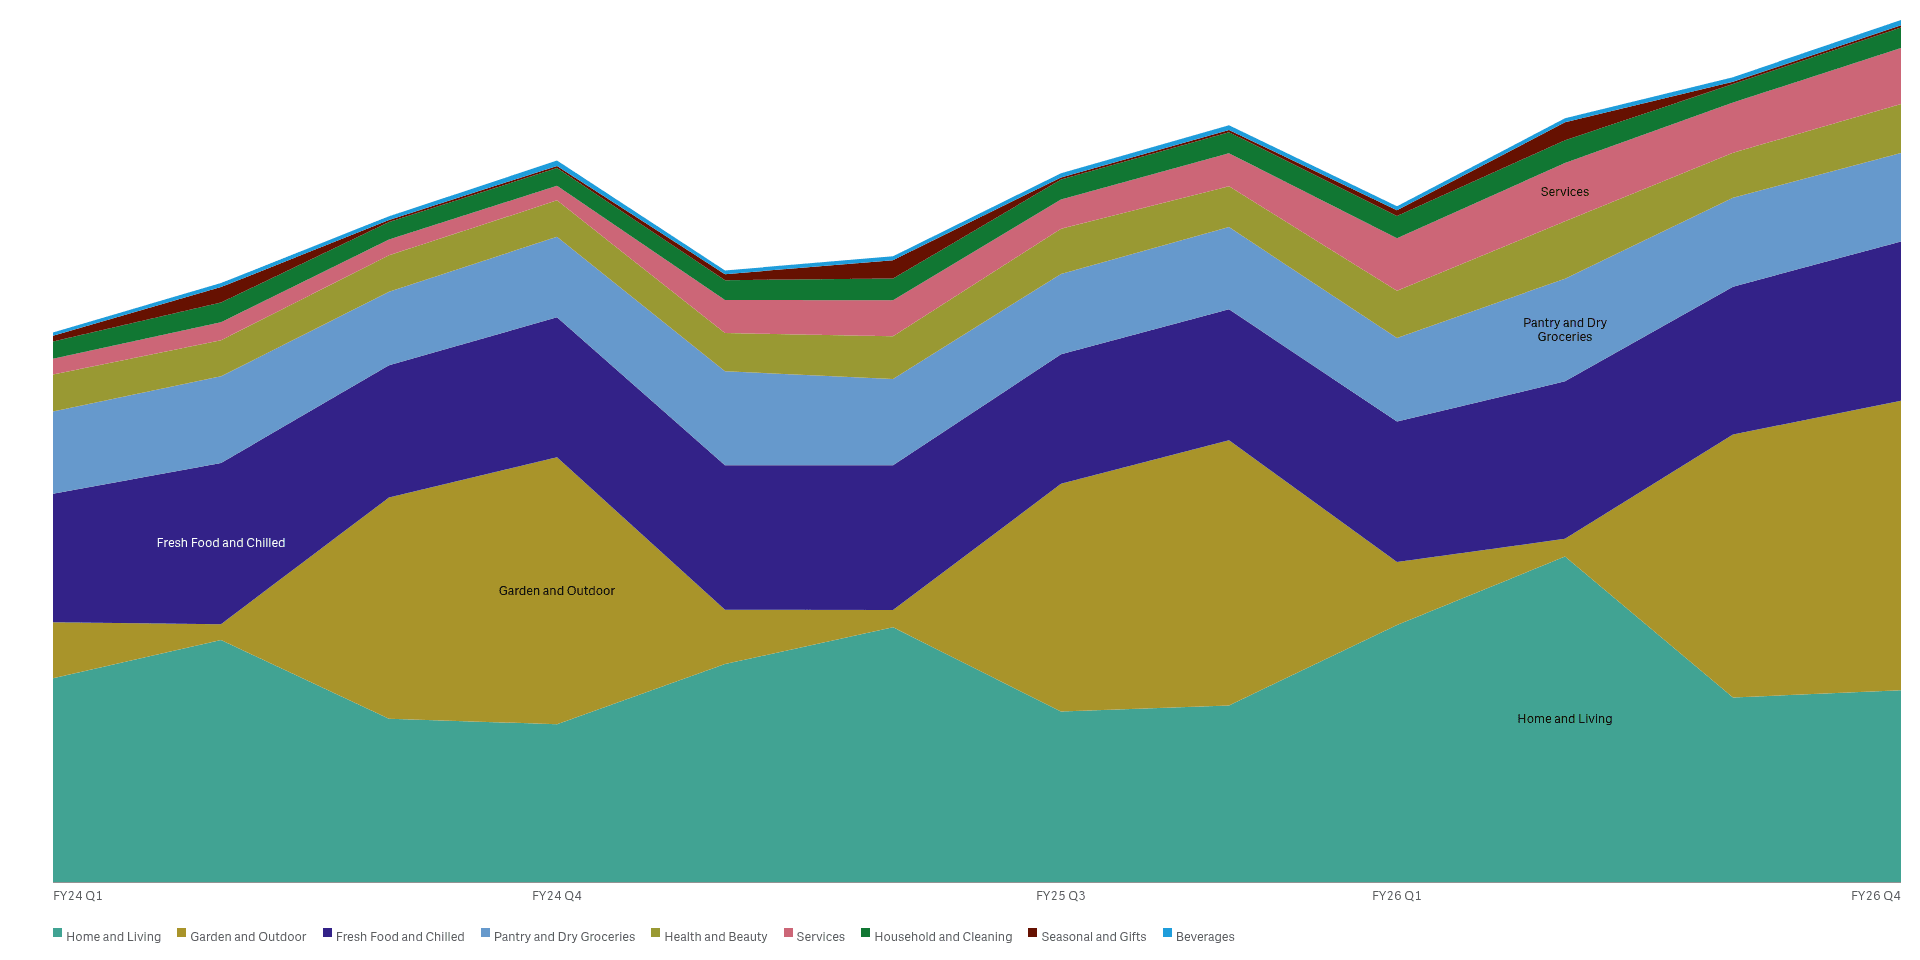
Watch the mix change over time
A streamgraph stacks the groups into flowing bands, so you see which grow and which shrink.
See it working
 View full size
 View full size
Try it
Download
Version 2.1.6
Extension
Demo App
Release page on GitHub with every file and its checksum.
Install
Install an extension in Qlik Cloud or client-managed Qlik Sense.
Set up
Install notes
No install notes for this Product. See the general install page.
Docs
Release notes
No release notes yet.
How to get a license
- Review the Product Listing and its documentation.
- E-mail us the Product name, the name of your Qlik Cloud tenant and the number of users.
- We reply to you with the next step.