
Tm Visualization Suite: Variance & Targets
Are we on plan, and where do we miss the target?
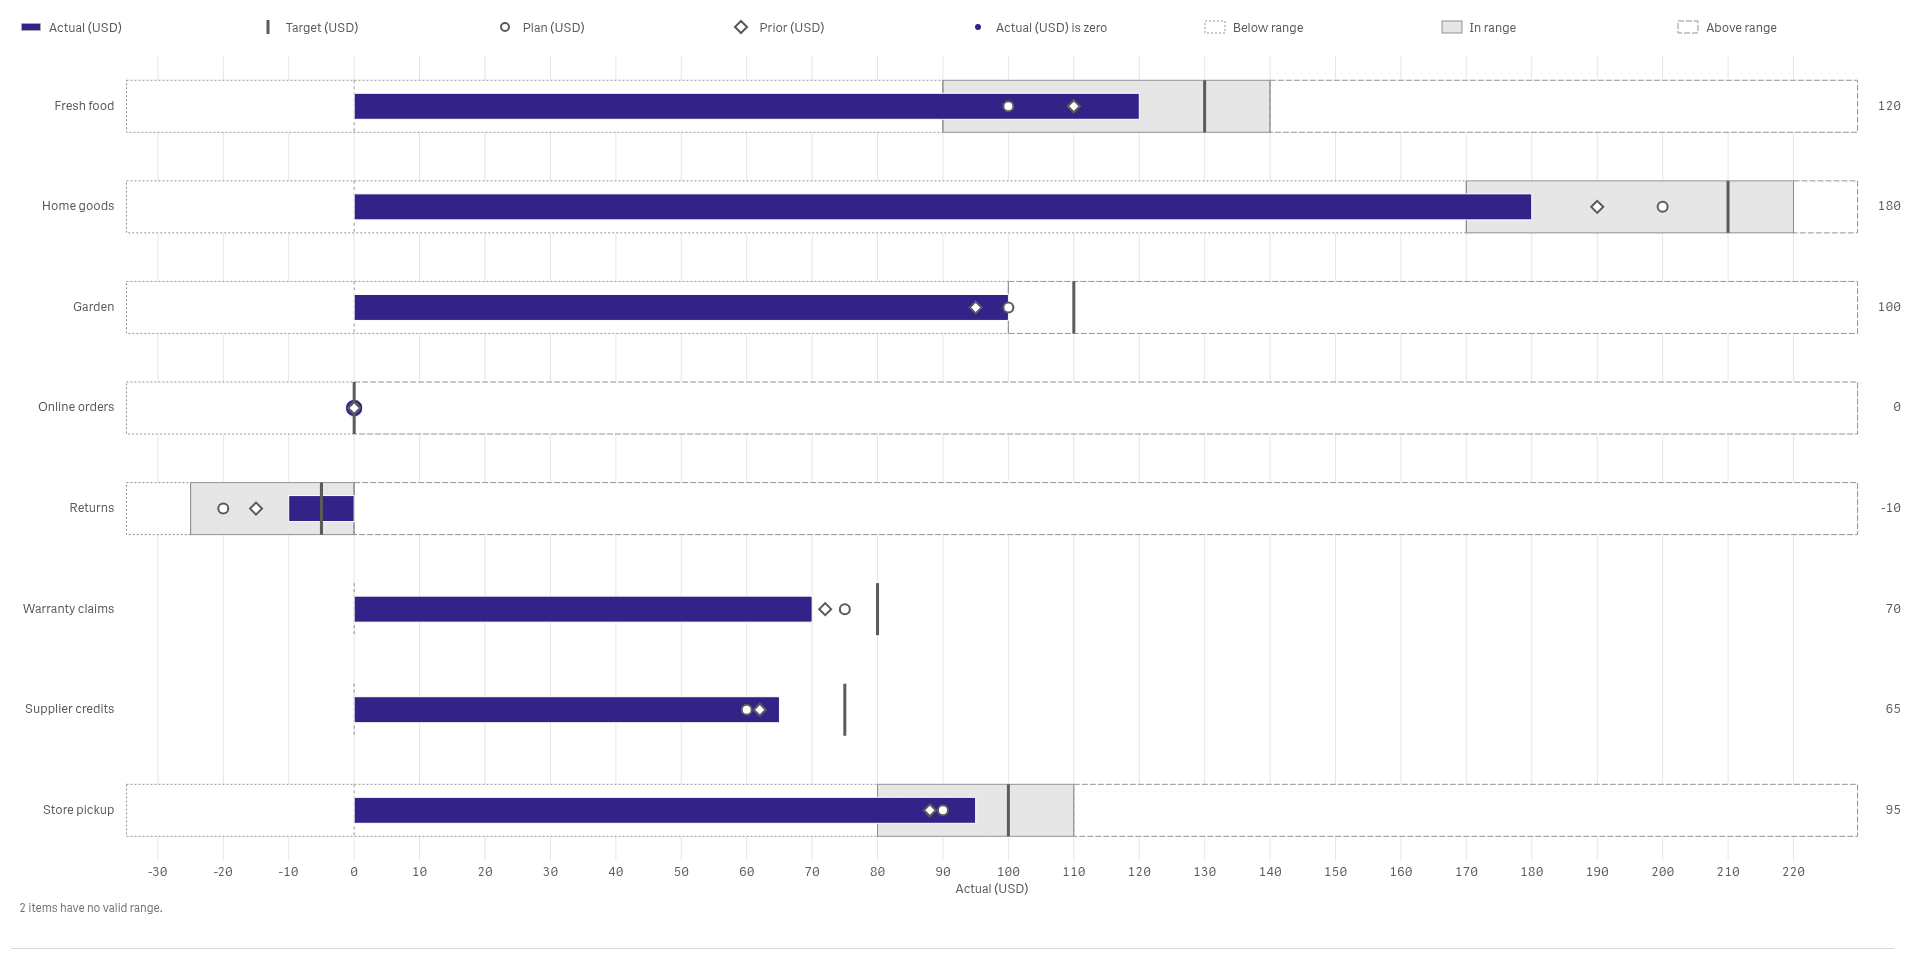 View full size
Version 2.1.6 · released 2026-11-03
Compare actual to plan and target for every item, and see who is ahead, who is behind and by how much.
What it does
Tm Visualization Suite: Variance & Targets compares actual with plan and target on one Qlik sheet object. A bullet chart shows each item against its range, a waterfall shows how the pieces add up to the total, variance bars show the gap to plan, a target band tracks a value over time and a pace chart shows whether the cumulative total will reach the final target.
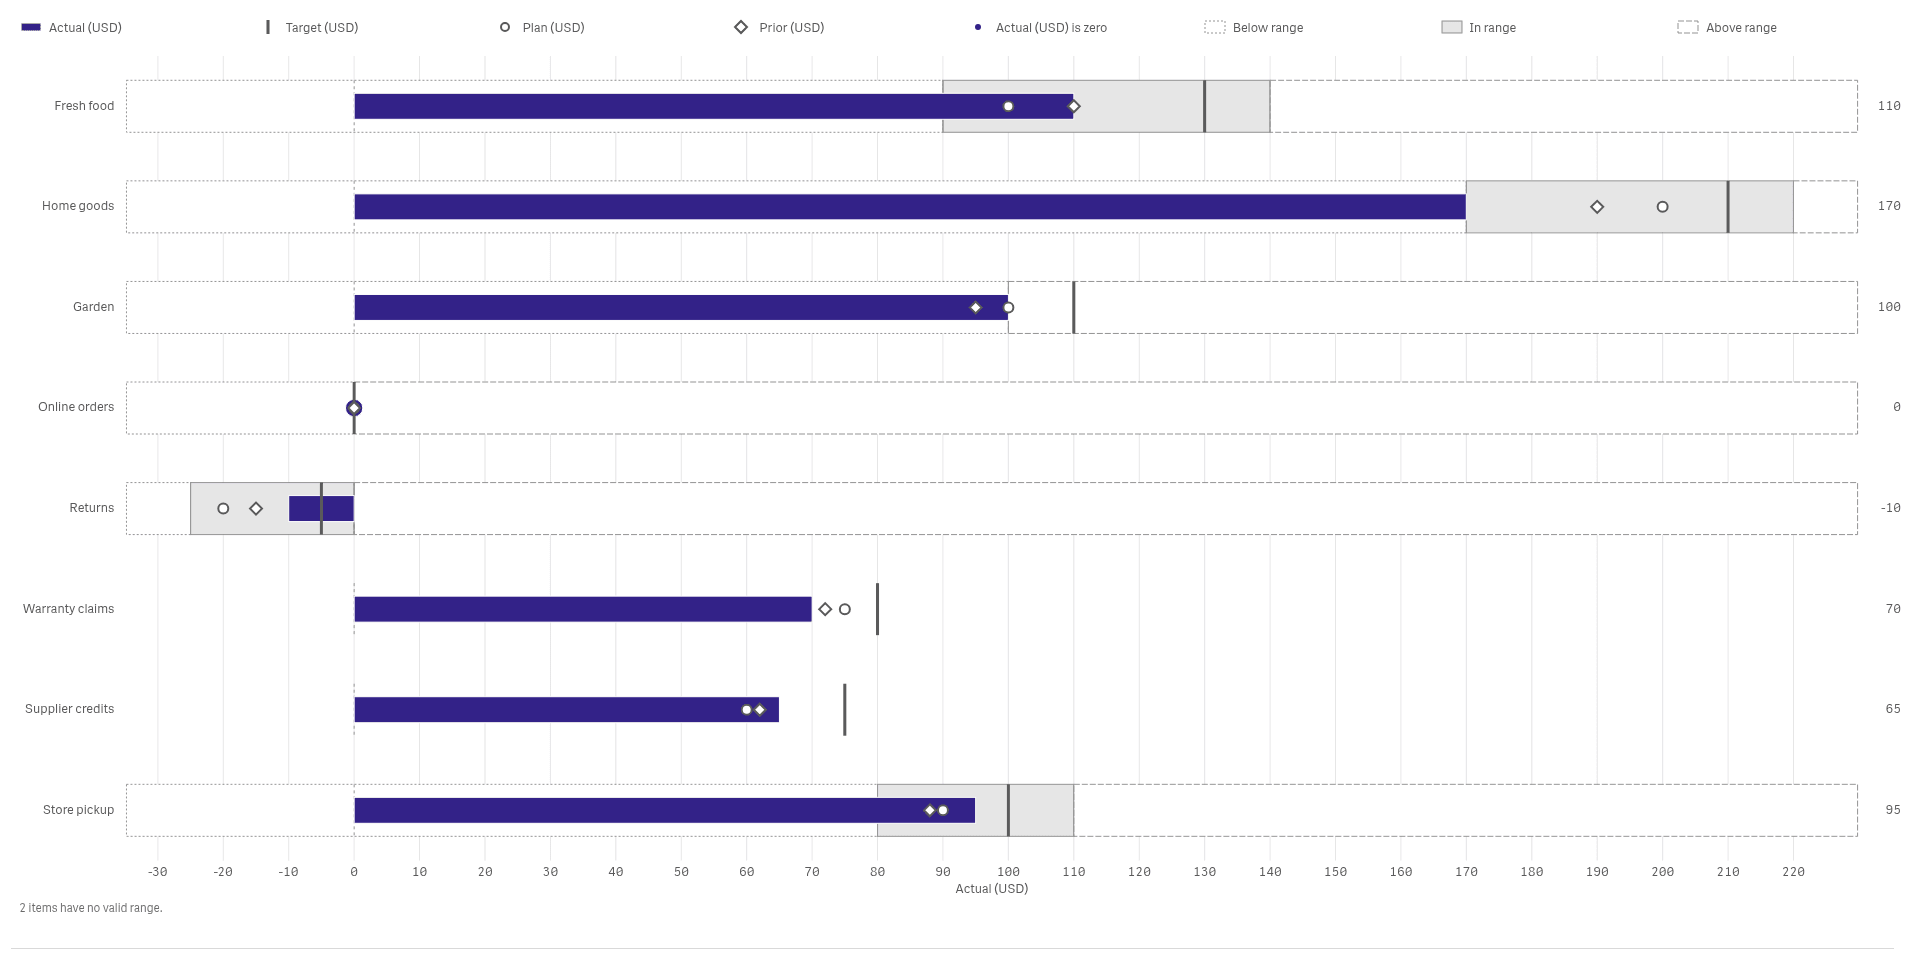
Click an item to select the data behind it, and the rest of the sheet follows. The charts read your data and never change it. Items without a valid range are listed in a note under the chart.
Analysts and BI leads who report actual against plan and target in finance and operations.
Good for
- Which items miss their target this cycle?
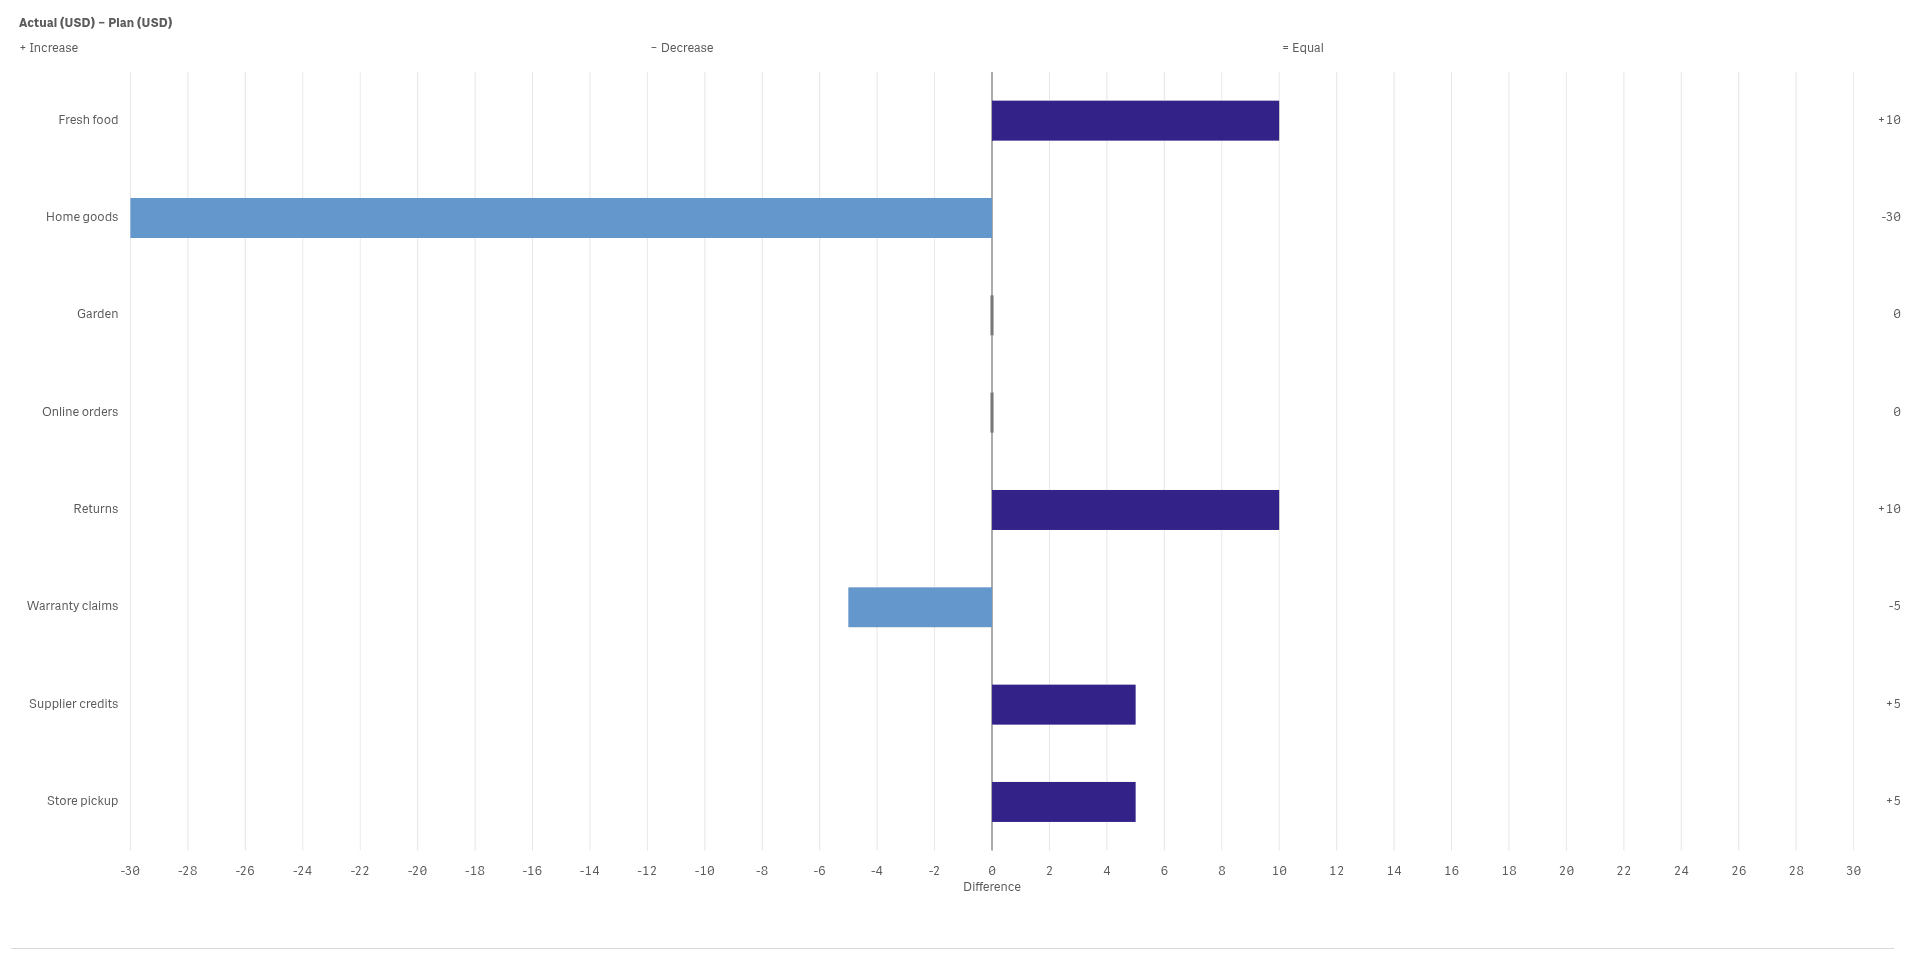
- How did actual change against plan, item by item?
- Are we on pace to reach the year-end target?
Key features
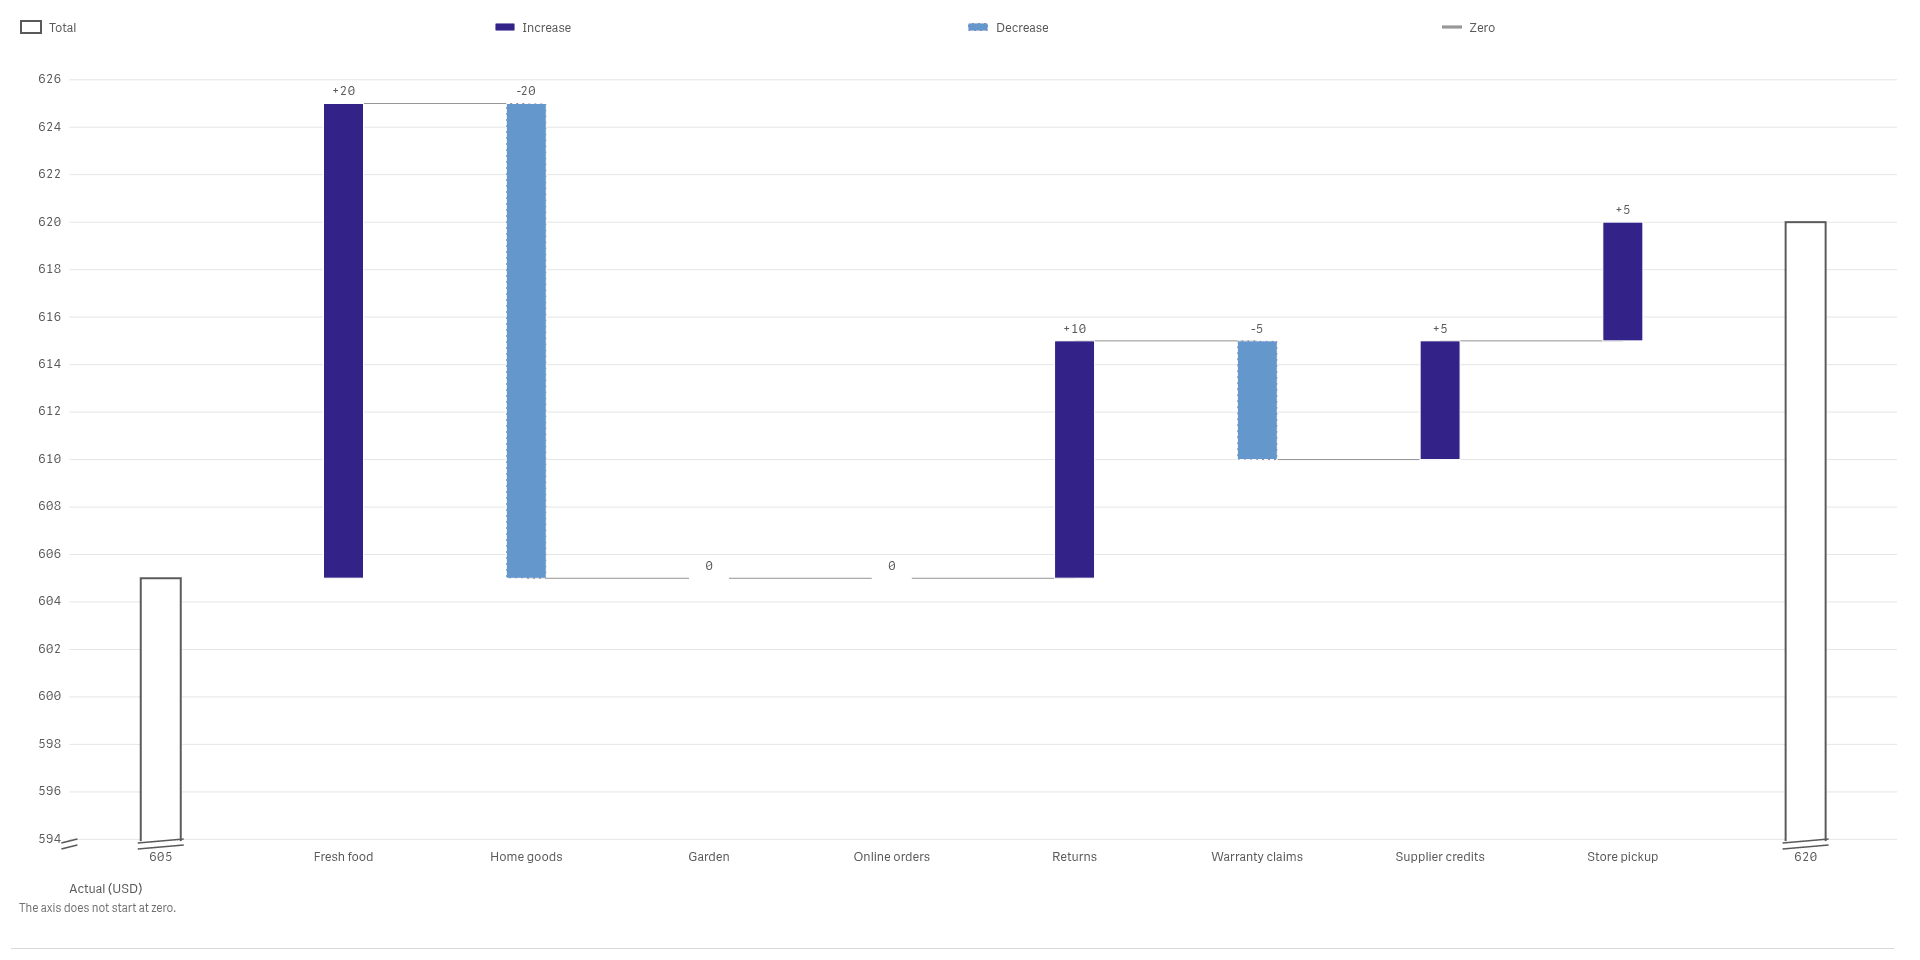
See how the pieces add up
A waterfall starts at the opening value and adds each increase and decrease, so you see what moved the total.
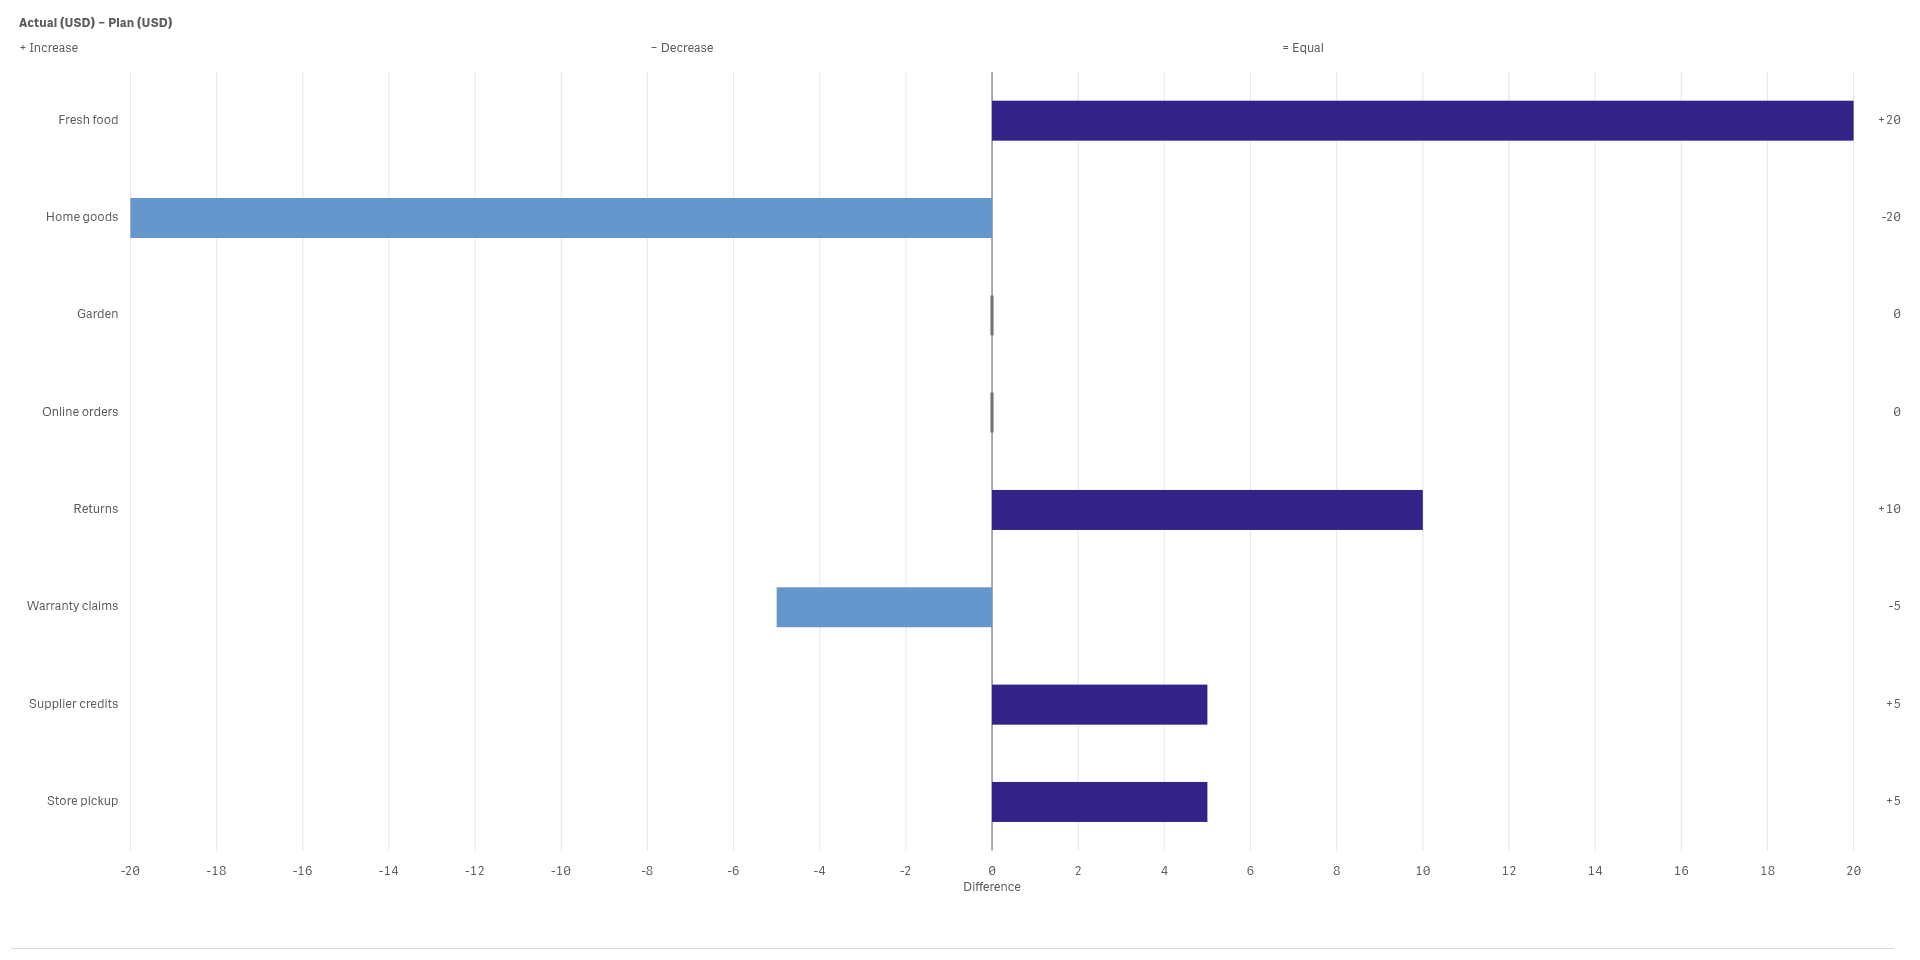
Show the gap to plan for each item
Variance bars grow right for ahead of plan and left for behind, so the biggest misses are easy to find.
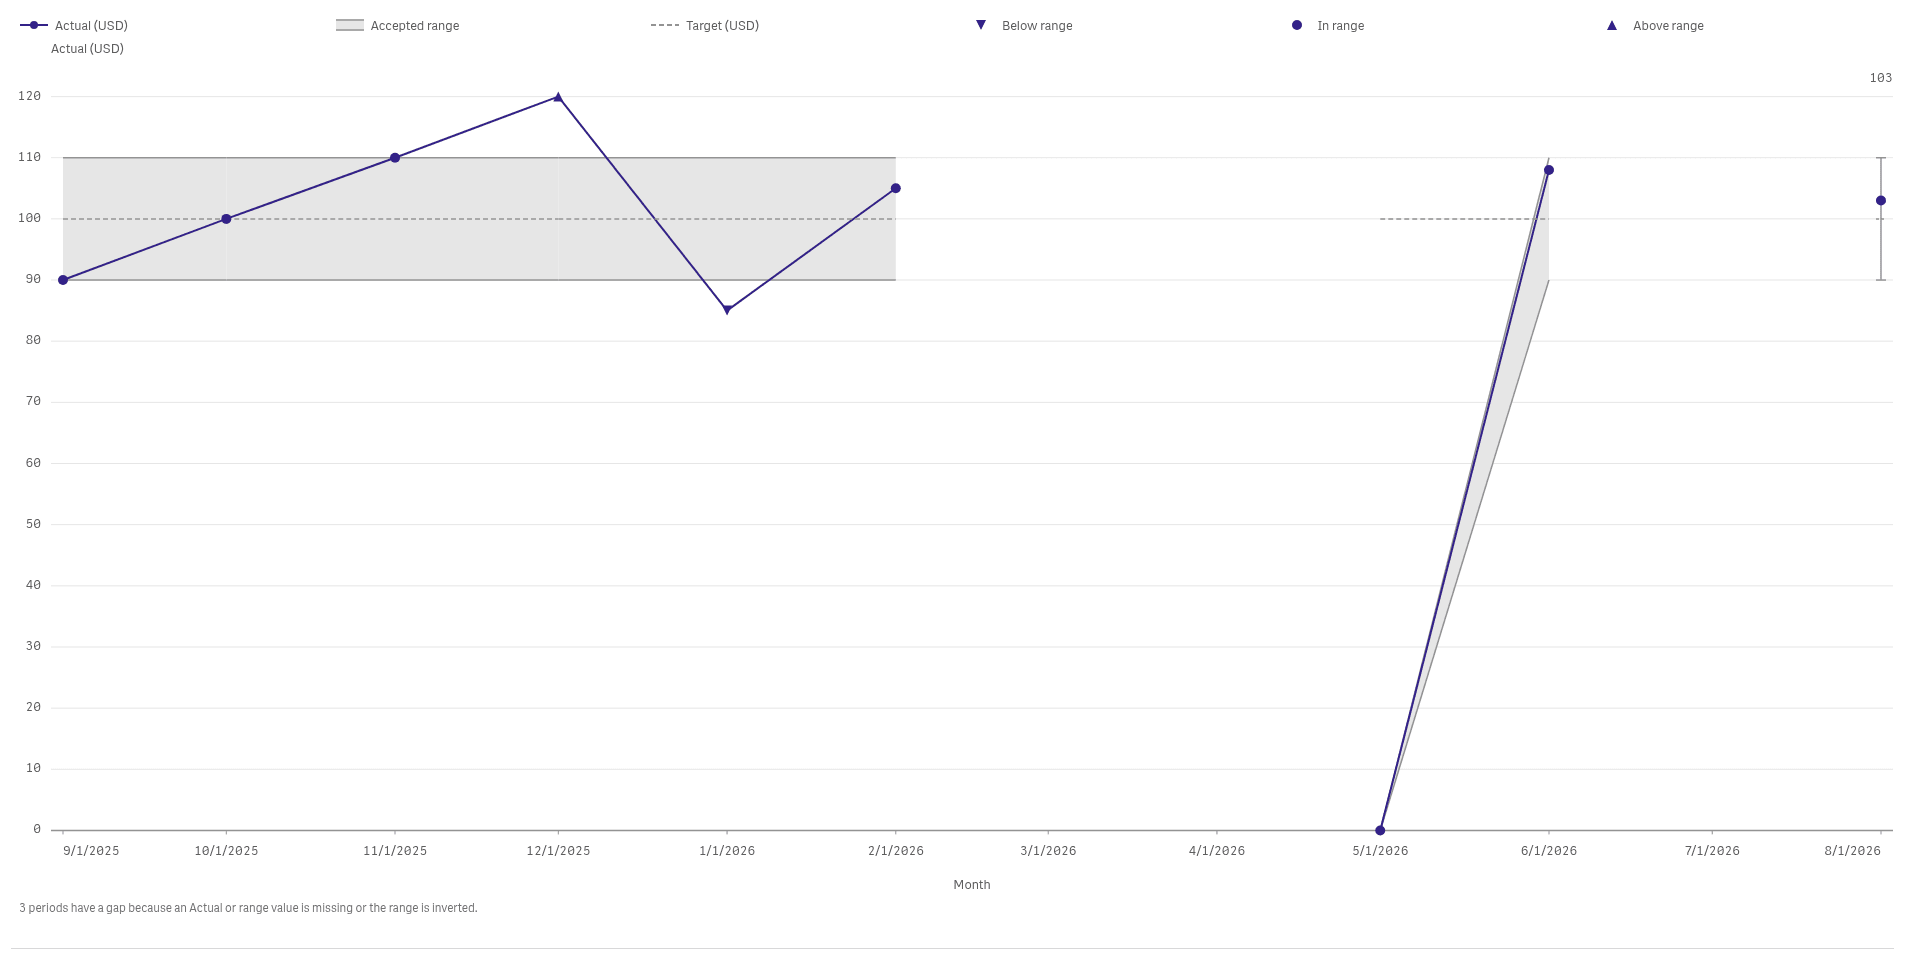
Track a value against its accepted range
A target band draws the value over time inside a shaded range, so a month outside it stands out.
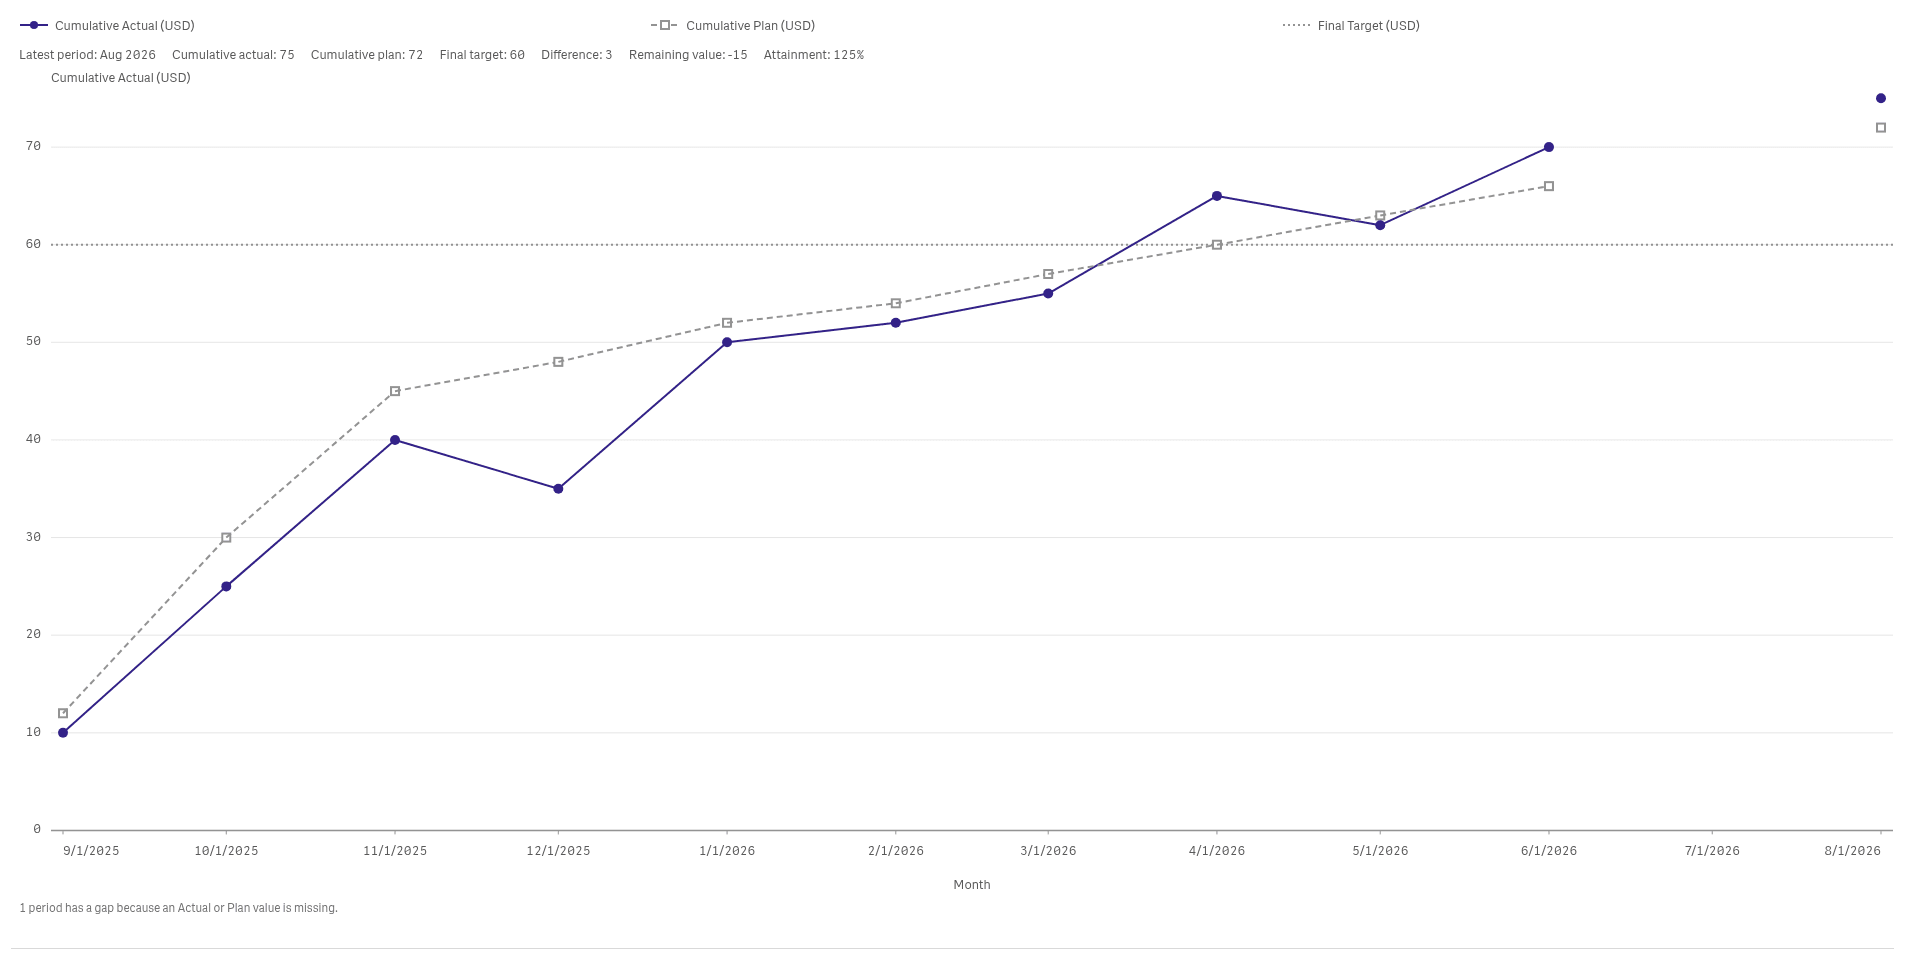
Check if you are on pace for the year
A pace chart compares the cumulative actual with the cumulative plan and the final target.
See it working
 View full size
 View full size
Try it
Download
Version 2.1.6
Extension
Demo App
Release page on GitHub with every file and its checksum.
Install
Install an extension in Qlik Cloud or client-managed Qlik Sense.
Set up
Install notes
No install notes for this Product. See the general install page.
Docs
Release notes
No release notes yet.
How to get a license
- Review the Product Listing and its documentation.
- E-mail us the Product name, the name of your Qlik Cloud tenant and the number of users.
- We reply to you with the next step.