
Tm Visualization Suite: Composition
What is the whole made of, and how do the parts compare?
 View full size
Version 2.1.6 · released 2026-11-03
Show how a total splits into parts, and how the mix differs from group to group.
What it does
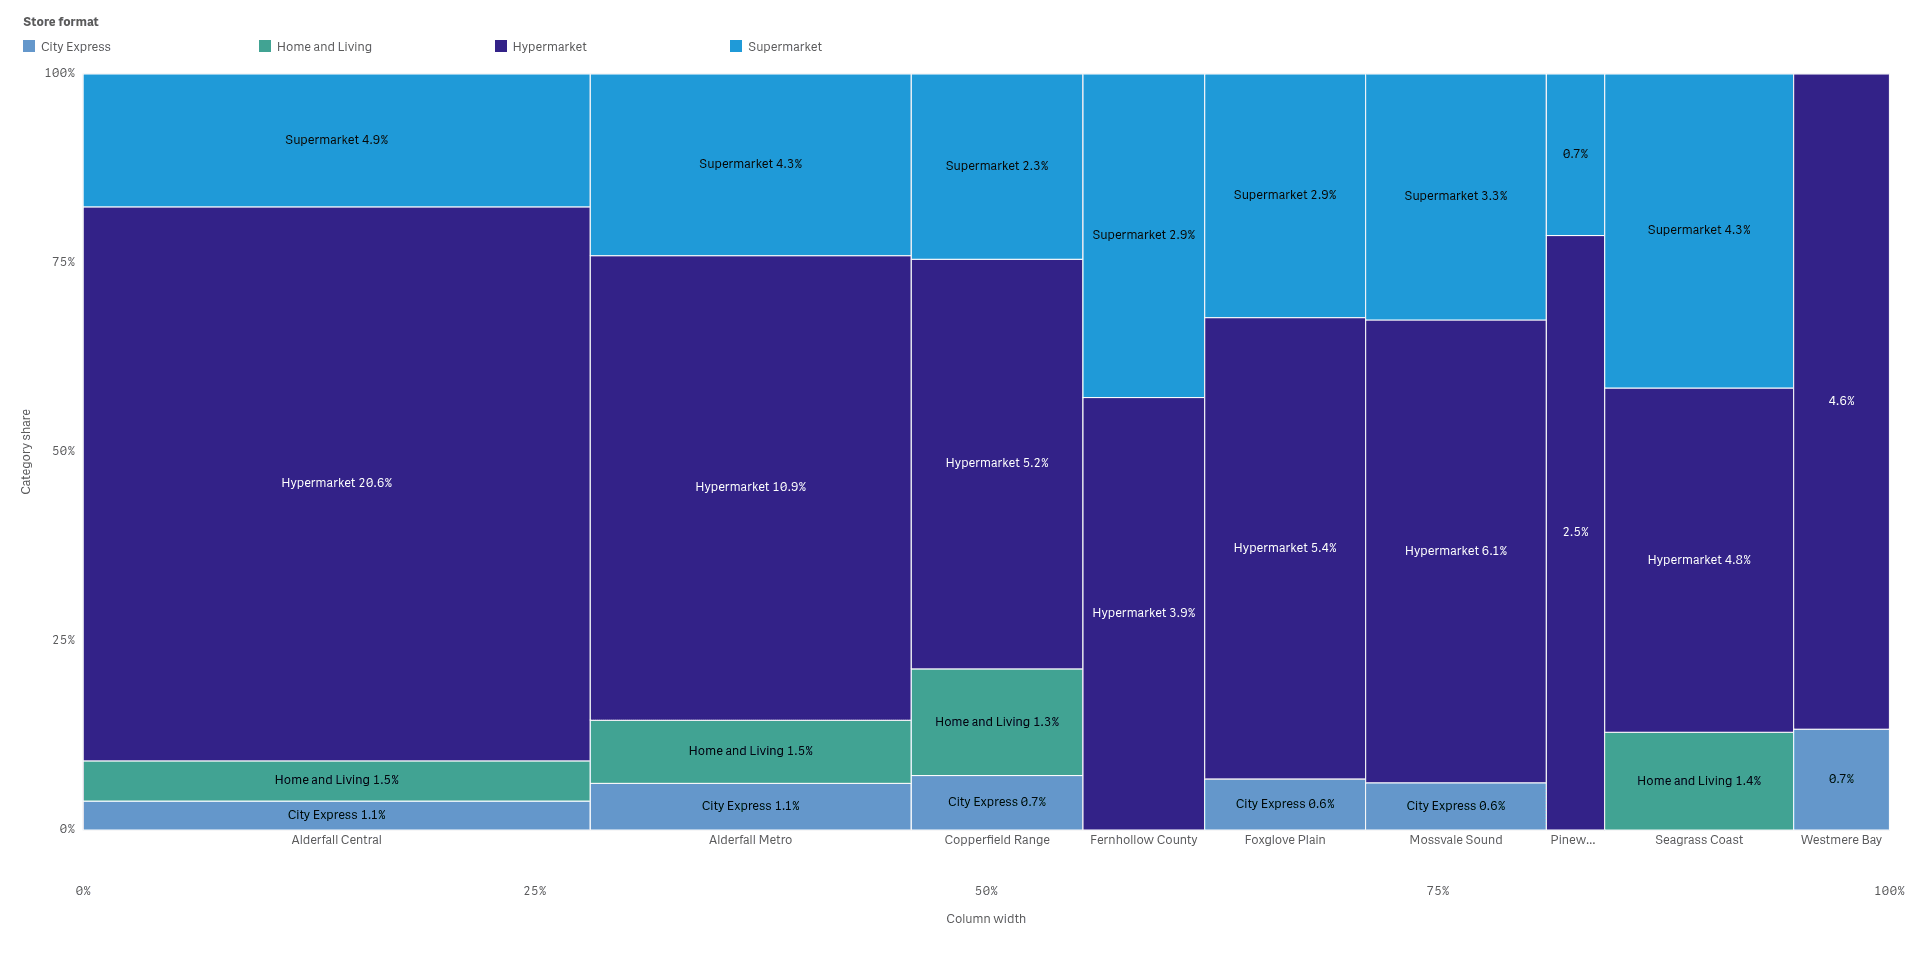
Tm Visualization Suite: Composition shows how a total splits into parts on one Qlik sheet object. Stacked bars to 100 percent, a waffle of squares, rows of unit marks, a mosaic that sizes both width and height, and a flow between two lists each answer "what is it made of" in a different way.
Click a part to select the data behind it, and the rest of the sheet follows. The charts read your data and never change it. Parts that are too small to read are grouped as Other, and the chart says so.
Analysts and BI leads who explain a total through its parts and compare the mix between groups.
Good for
- Which delivery methods does each order channel use?
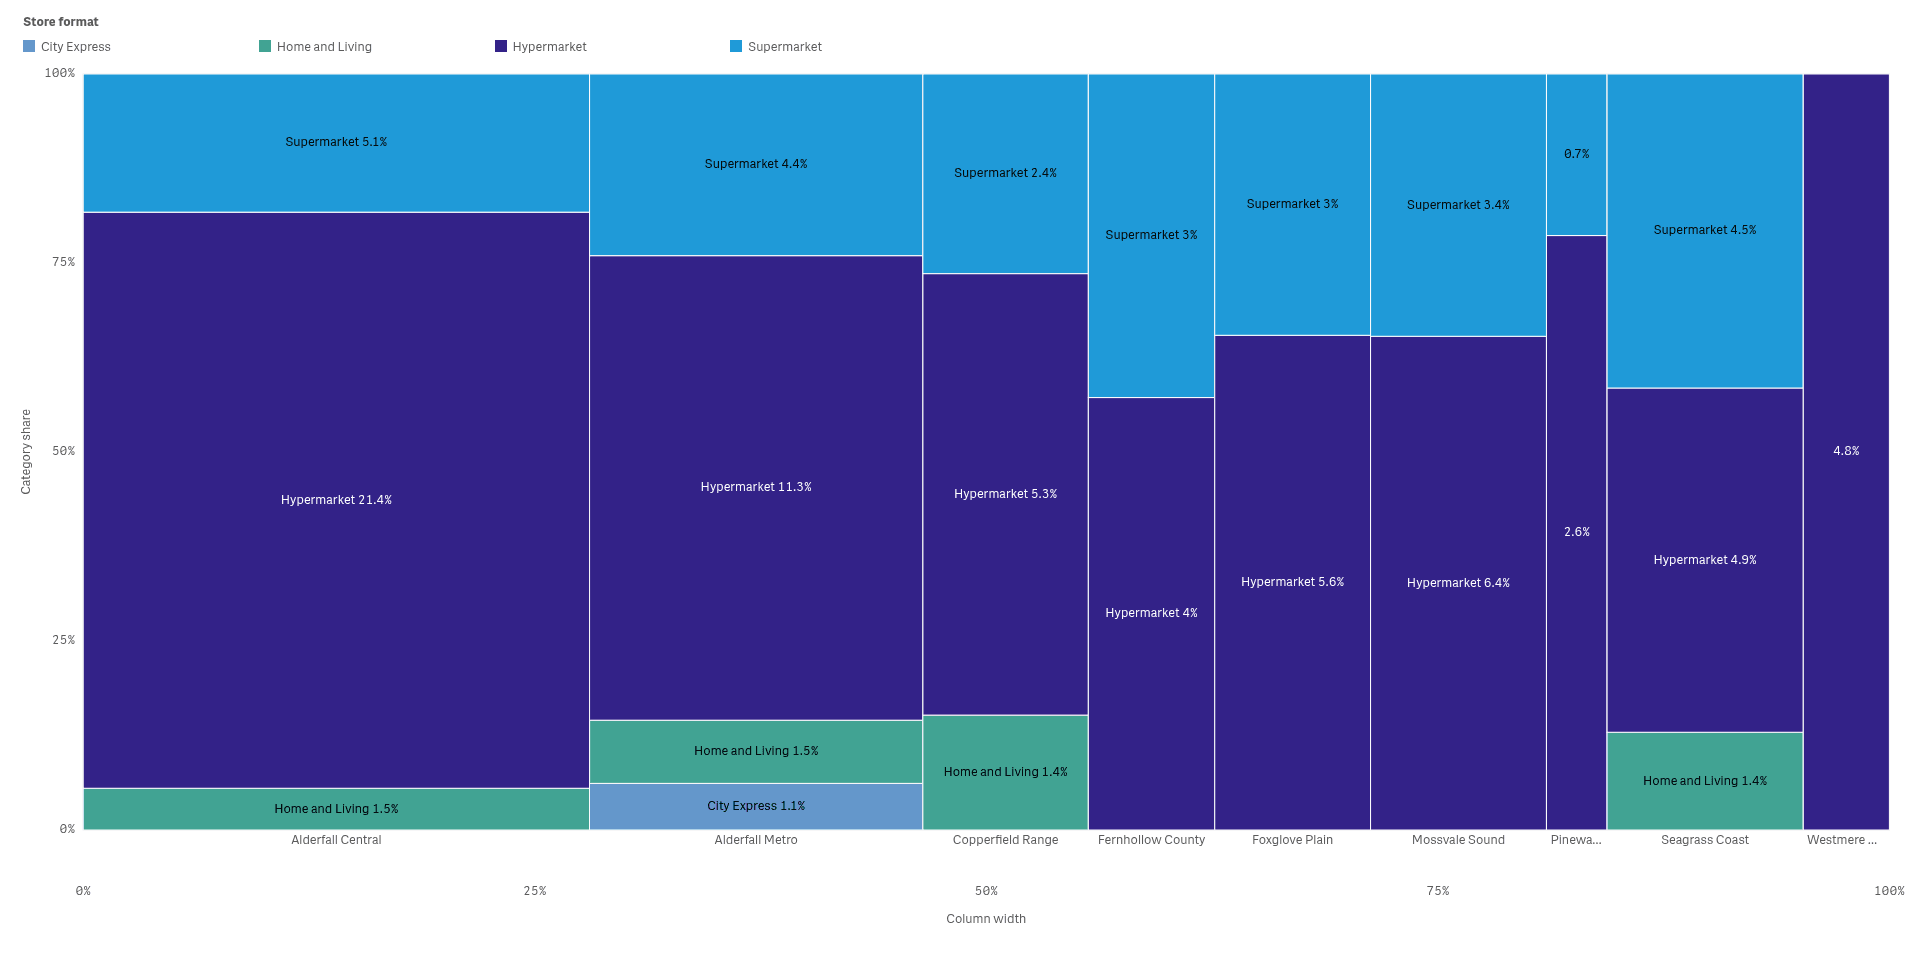
- How does the mix of customer segments differ by store?
- Which parts make up most of the total?
Key features
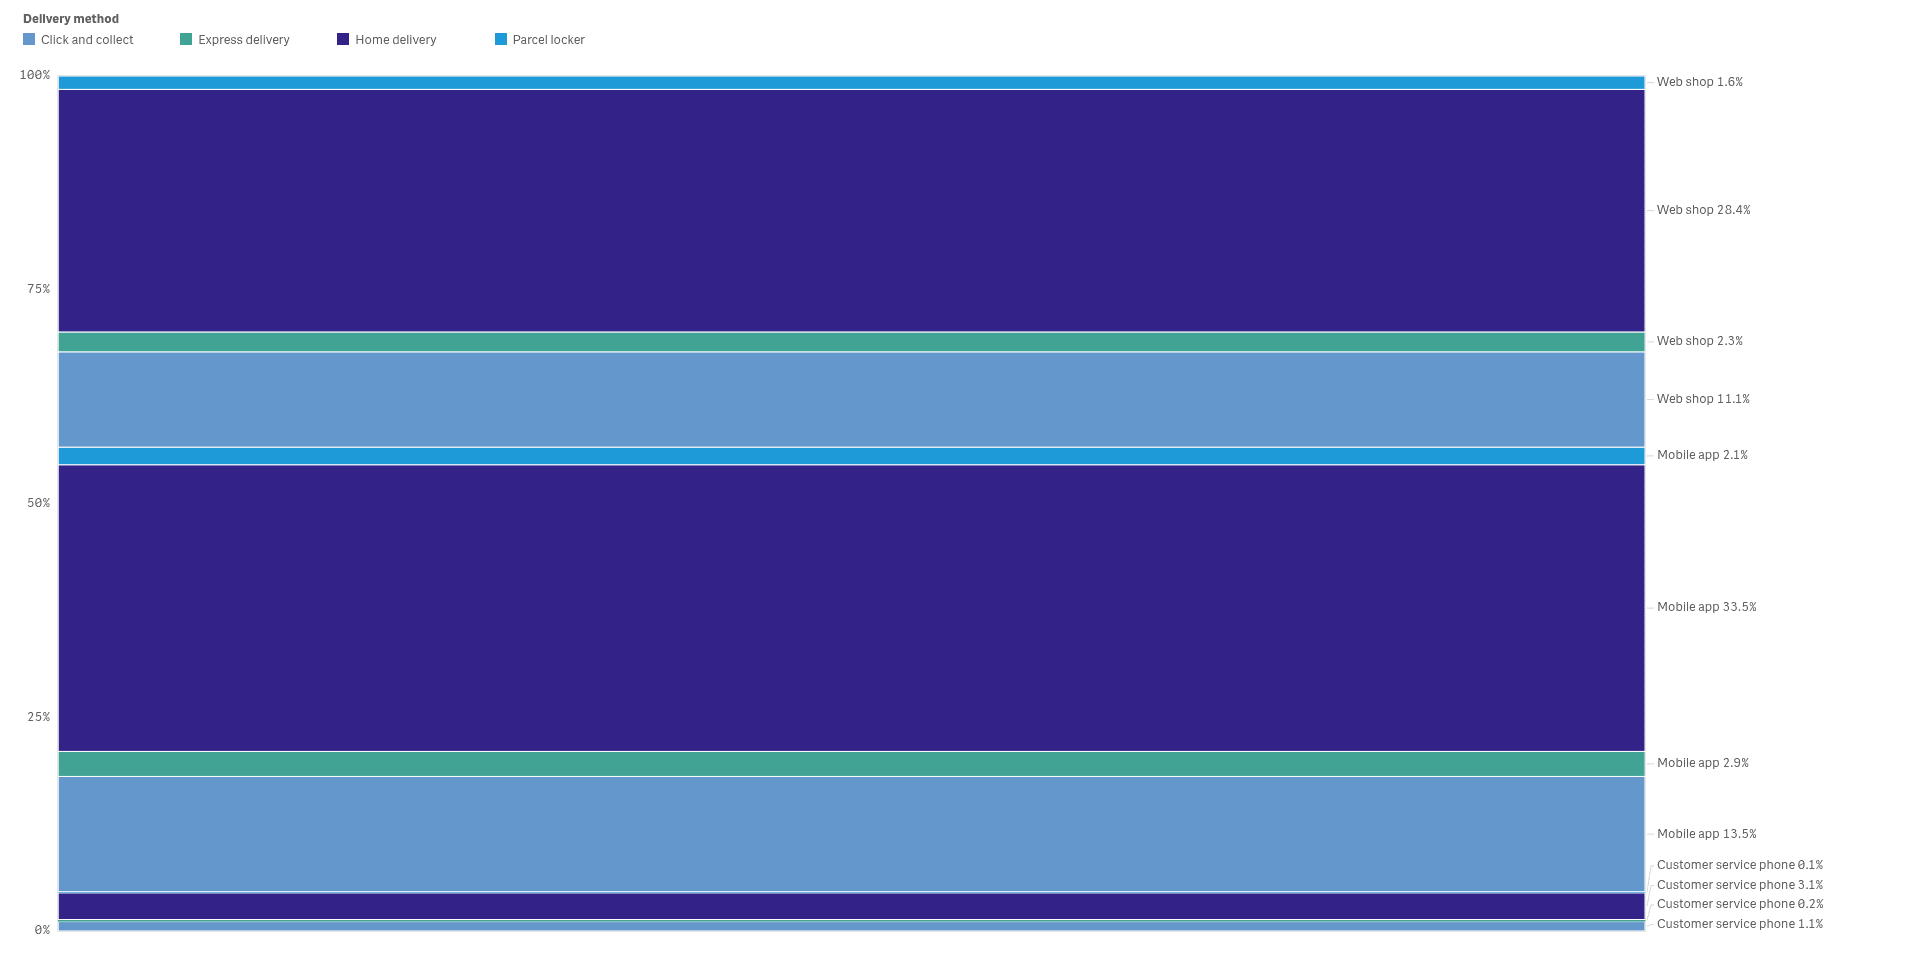
Read one whole as 100 percent
A stacked bar splits the whole into its parts, so the biggest parts are easy to compare.
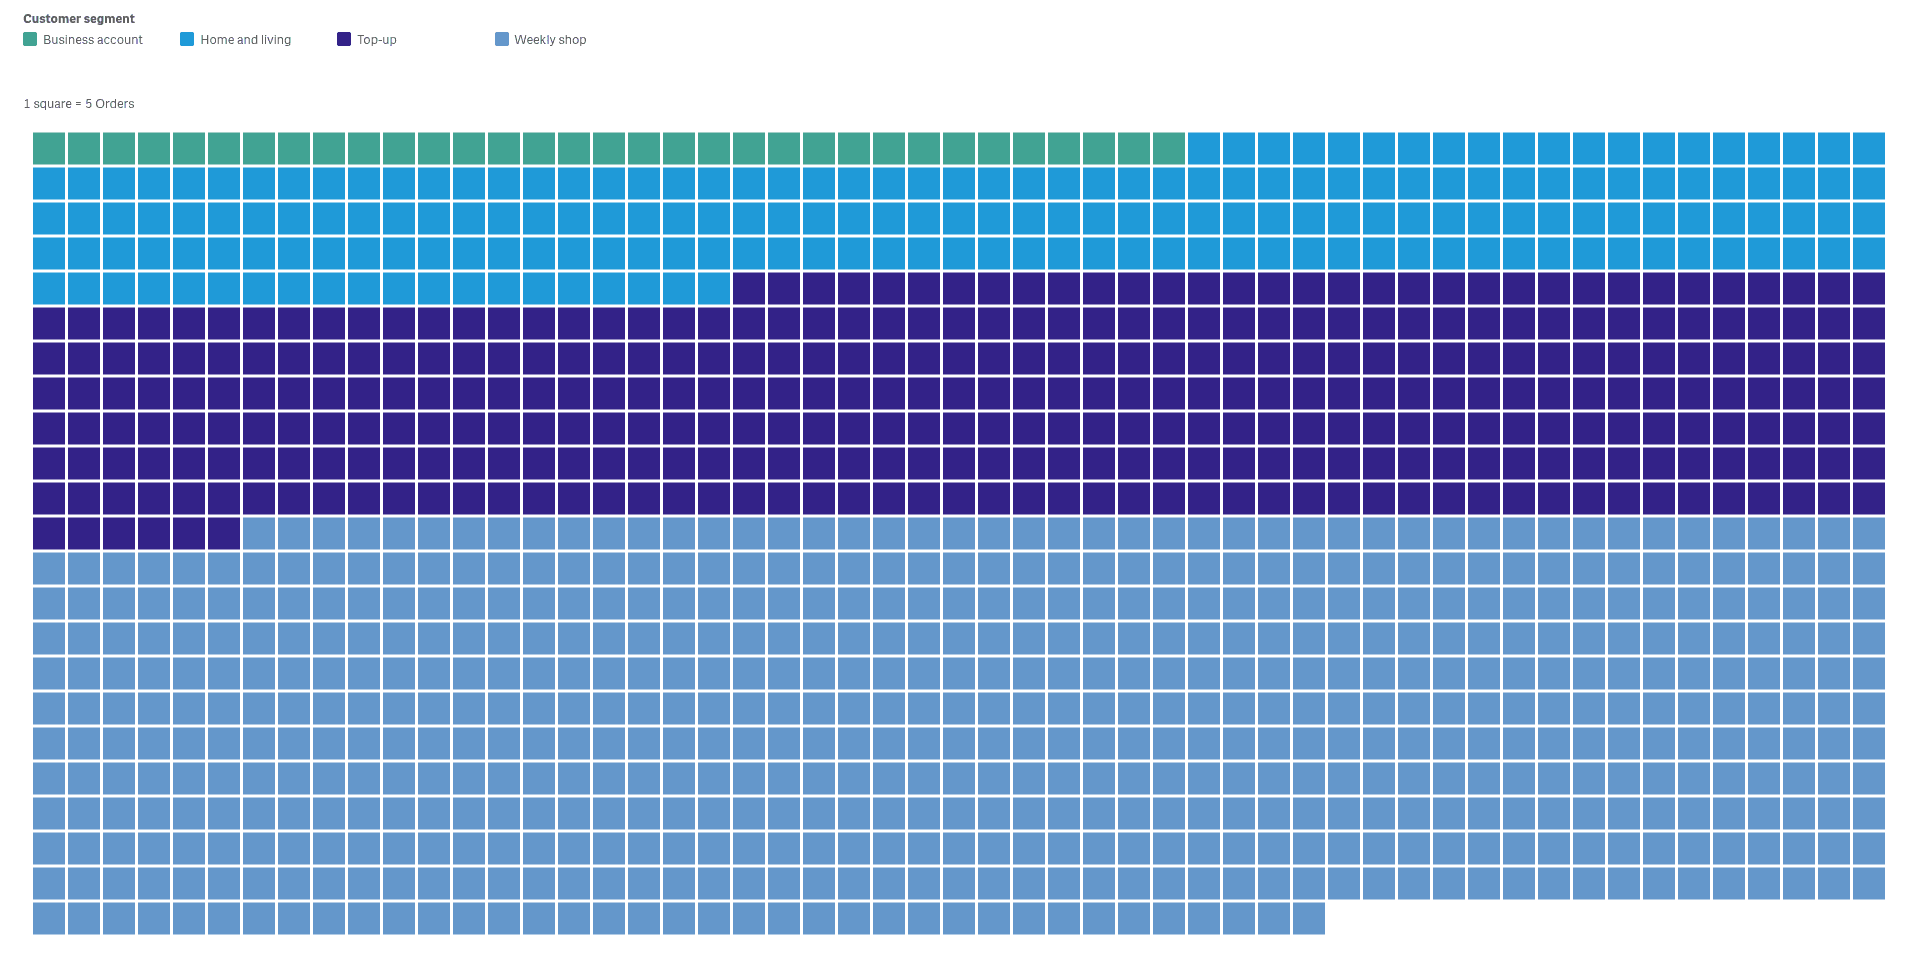
Count the parts as squares
A waffle gives each order a small square, so the share of each segment reads as a count you can see.
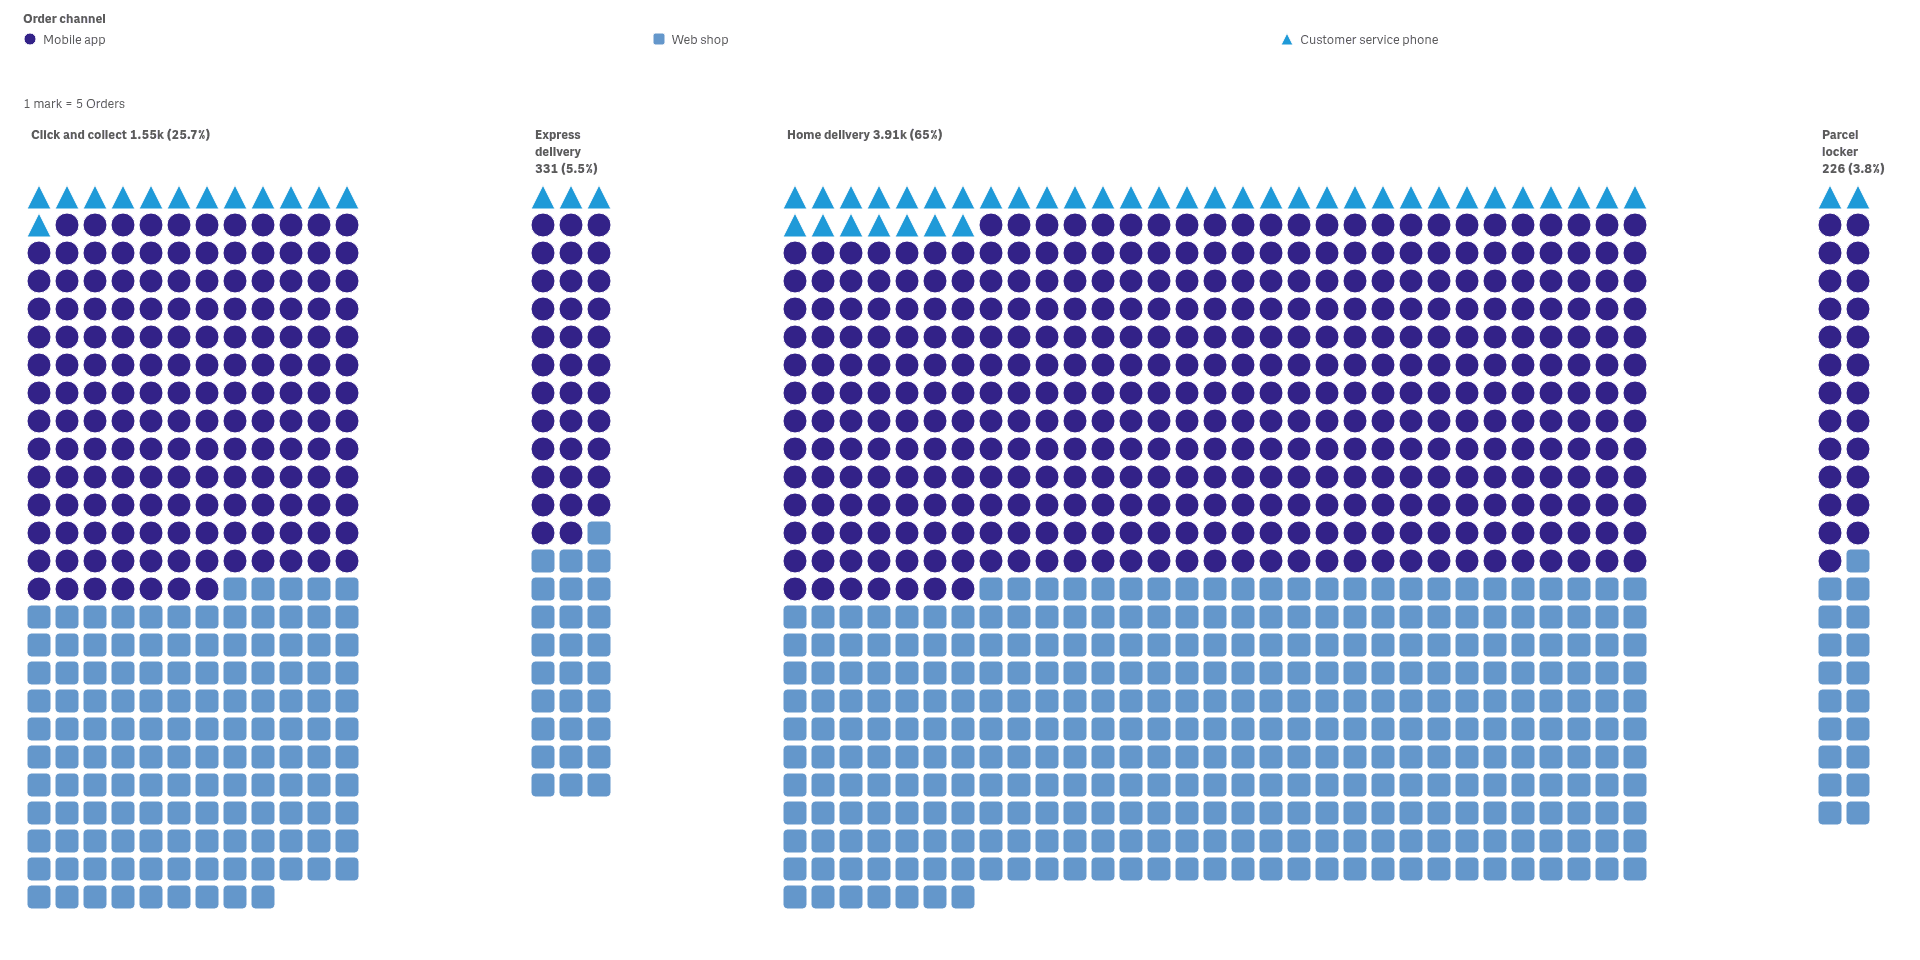
Compare groups with one mark per unit
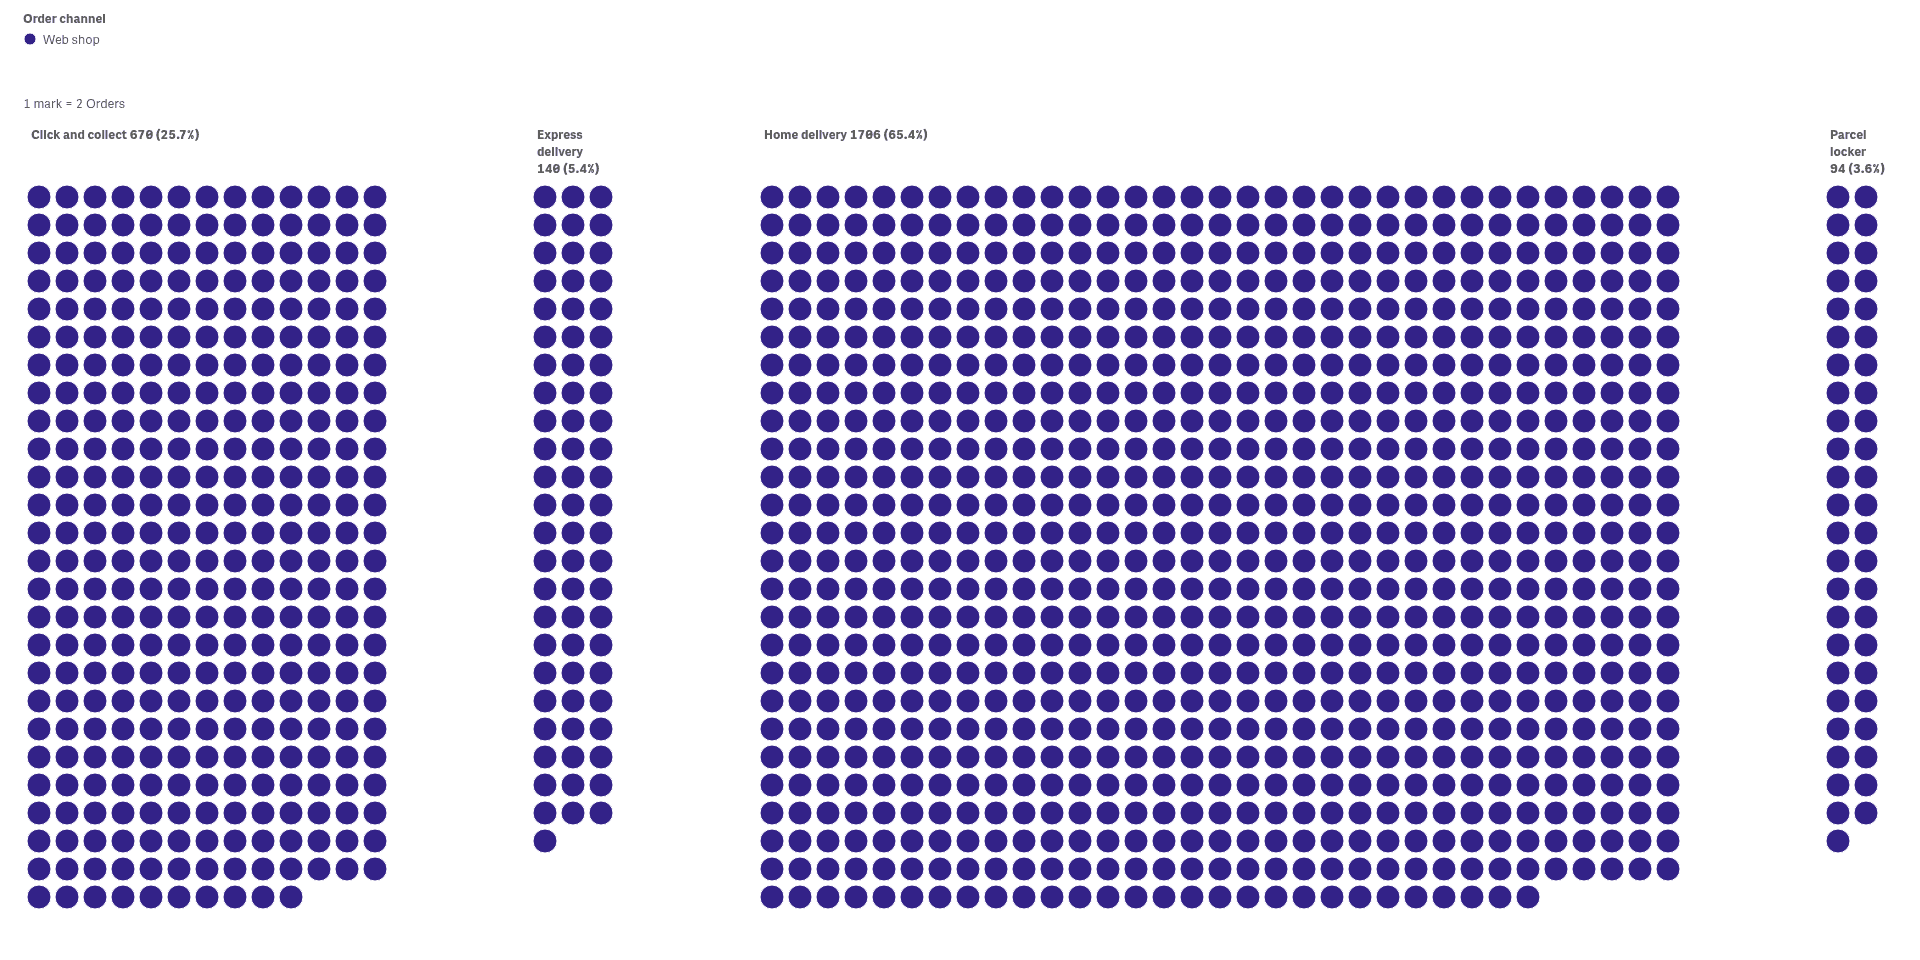
Unit marks stack a symbol for every order under each delivery method, so group size and mix show together.
Follow parts from one list to another
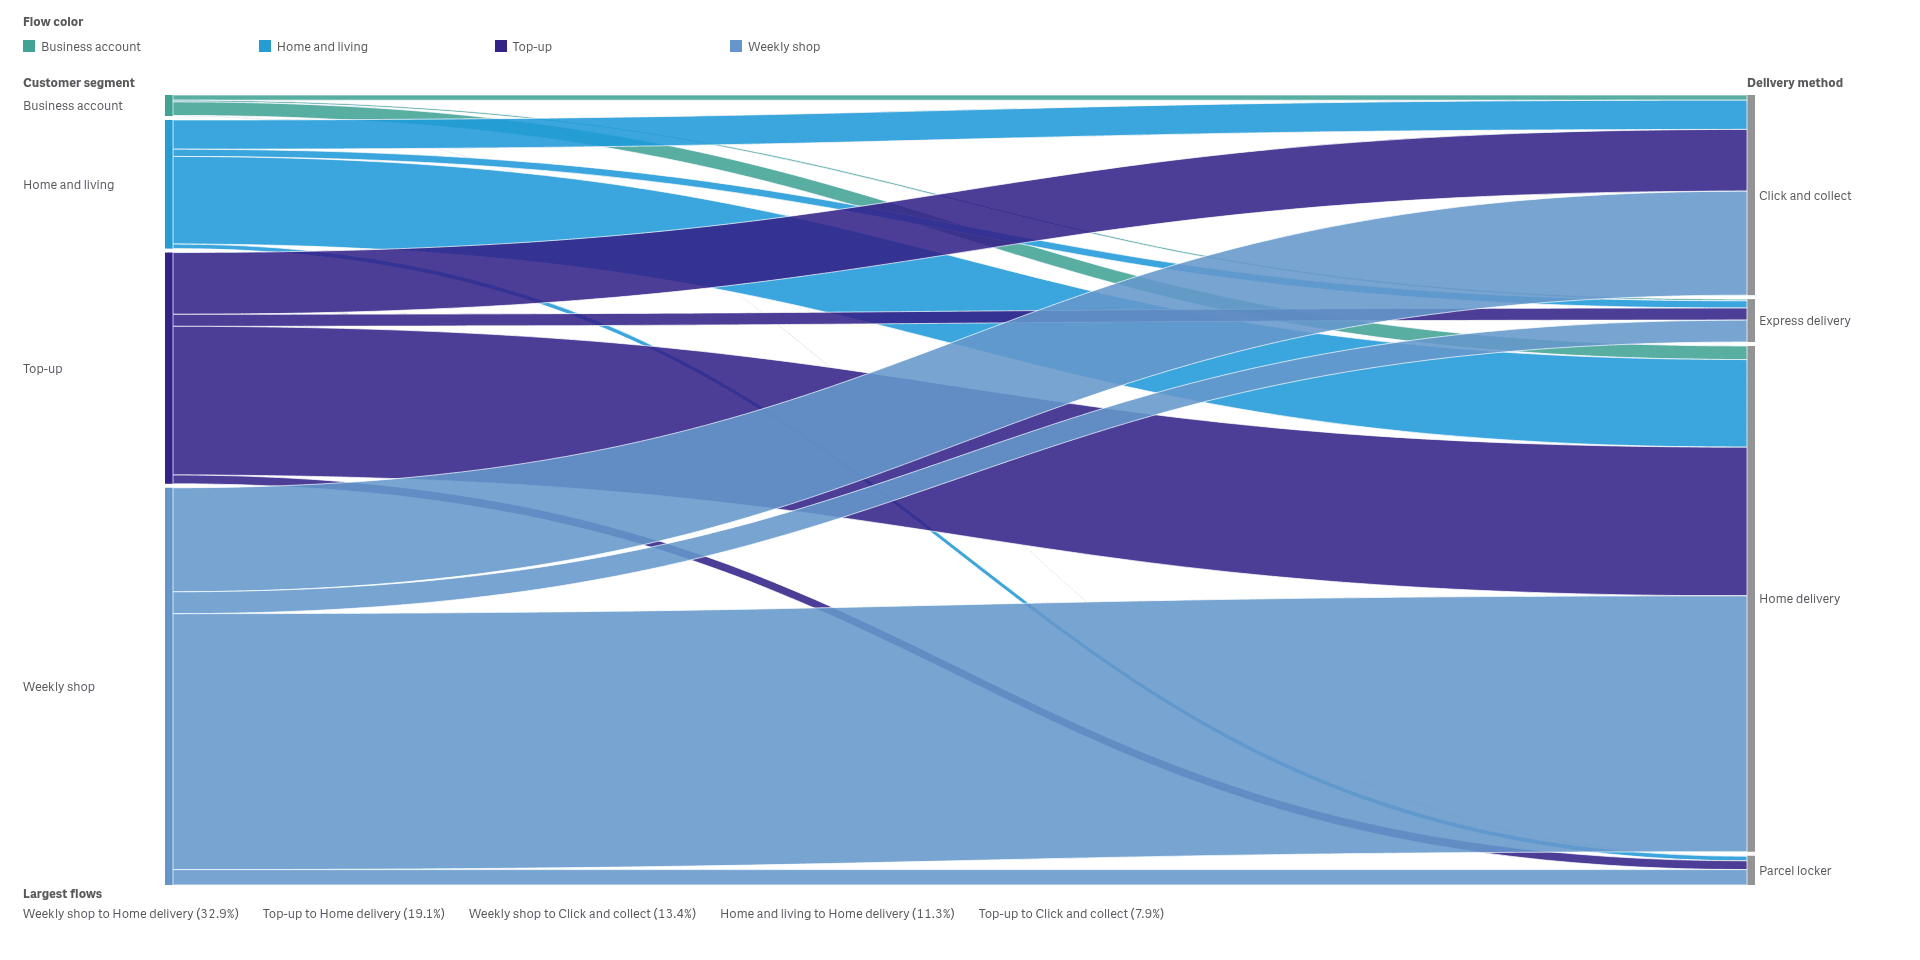
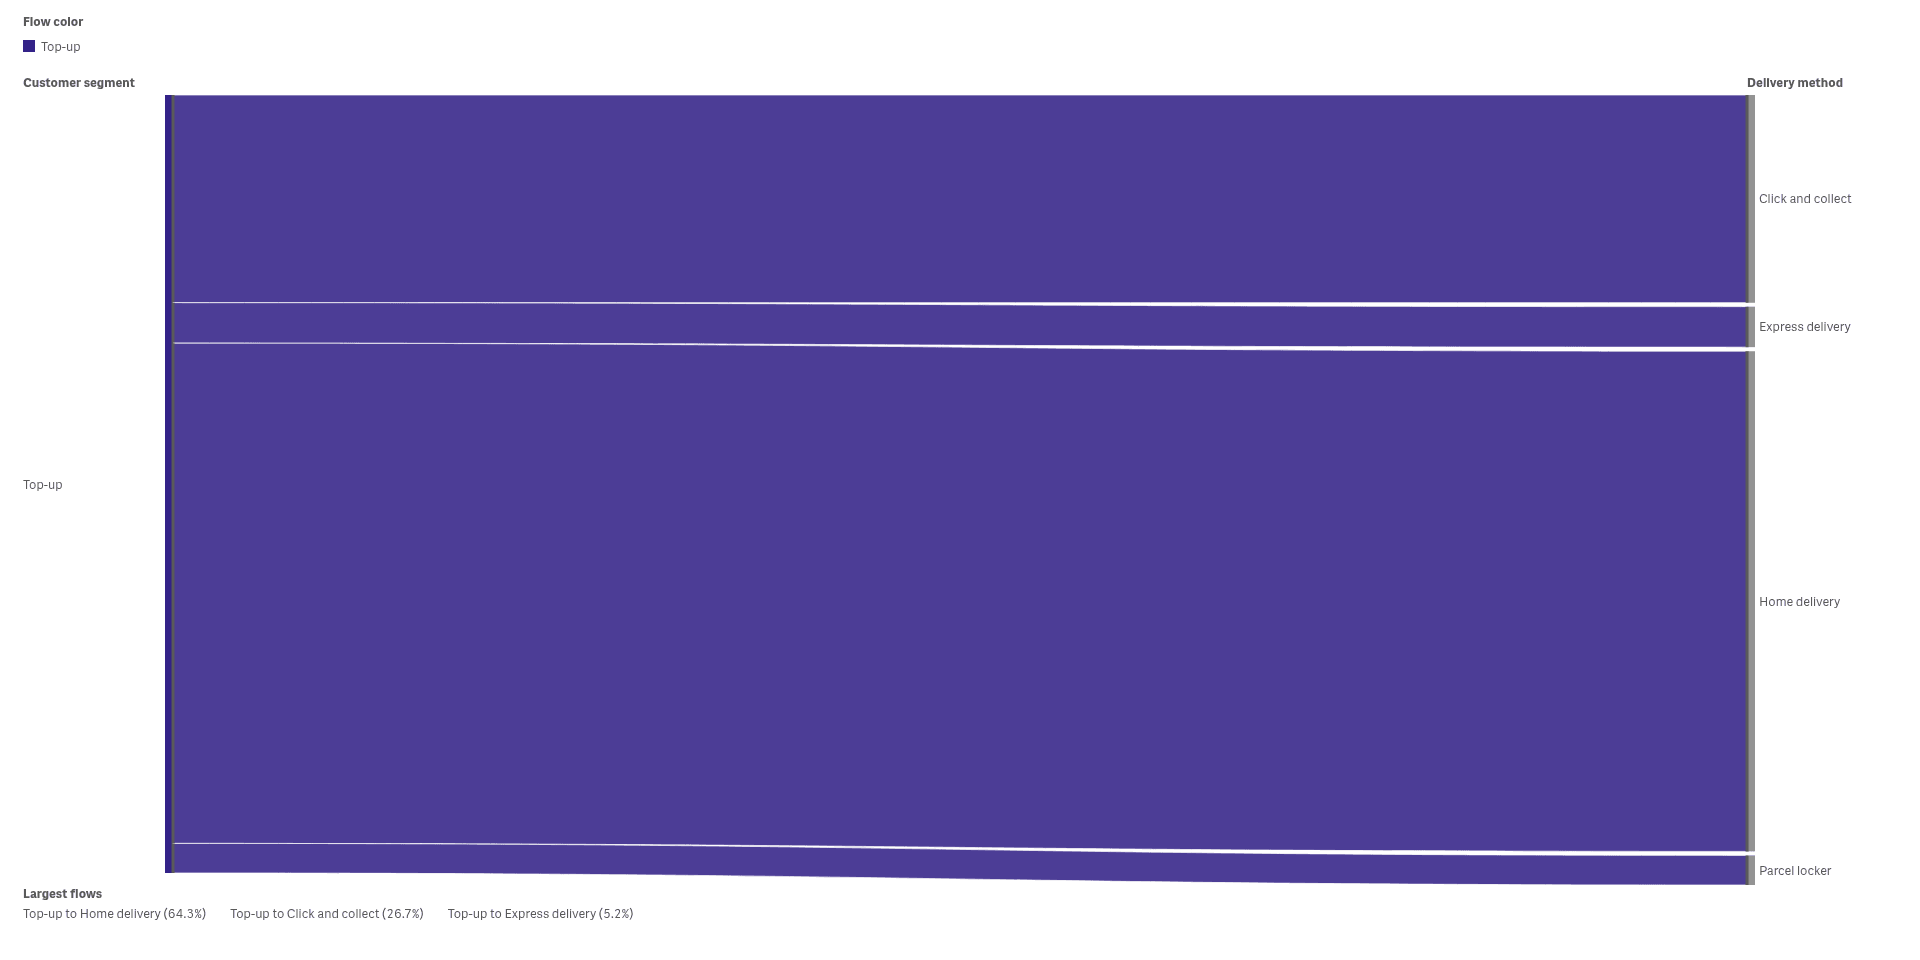
Parallel sets draw bands between two lists, so you see how one grouping splits into the other.
Pick a channel and see its mix
Select an order channel and the mosaic shows only its orders, so you compare its mix with the rest.
See it working
 View full size
 View full size
Try it
Download
Version 2.1.6
Extension
Demo App
Release page on GitHub with every file and its checksum.
Install
Install an extension in Qlik Cloud or client-managed Qlik Sense.
Set up
Install notes
No install notes for this Product. See the general install page.
Docs
Release notes
No release notes yet.
How to get a license
- Review the Product Listing and its documentation.
- E-mail us the Product name, the name of your Qlik Cloud tenant and the number of users.
- We reply to you with the next step.