
Tm Visualization Suite: Distribution Explorer
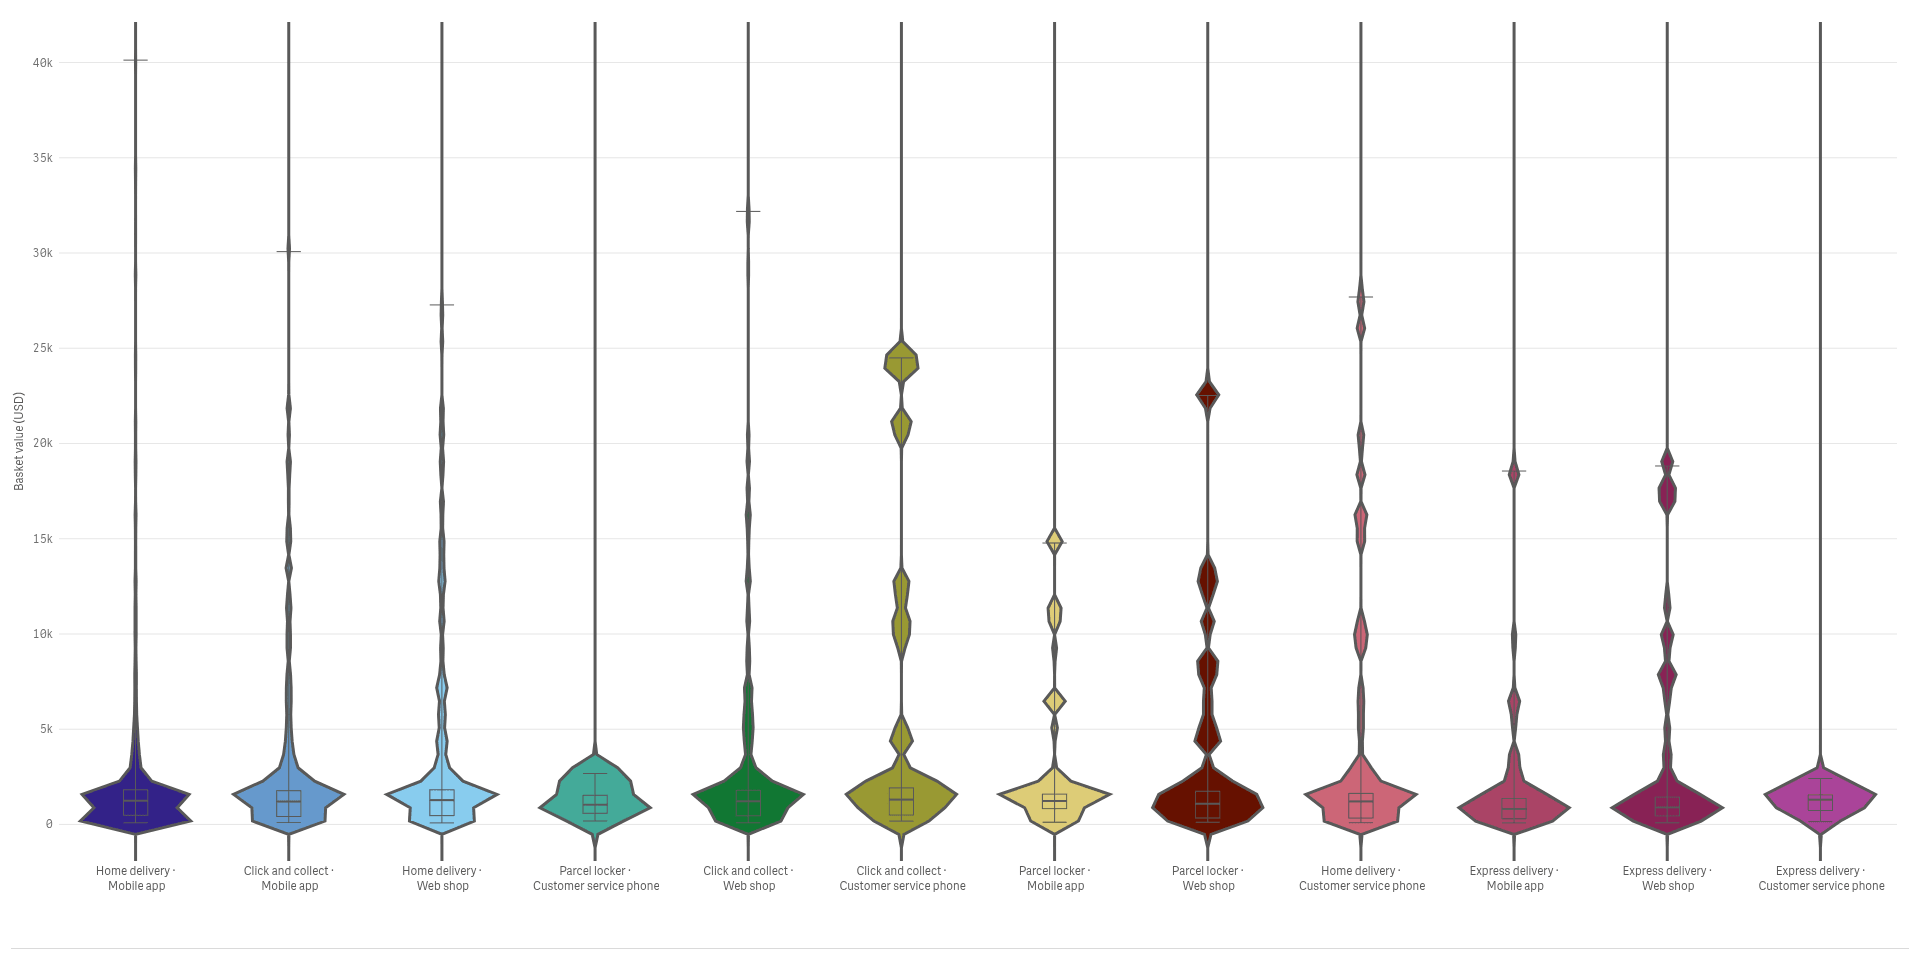
How are my values spread, and what hides behind the average?
 View full size
Version 2.1.6 · released 2026-11-03
See the full spread of your values, not just the average, and find the groups that behave differently.
What it does
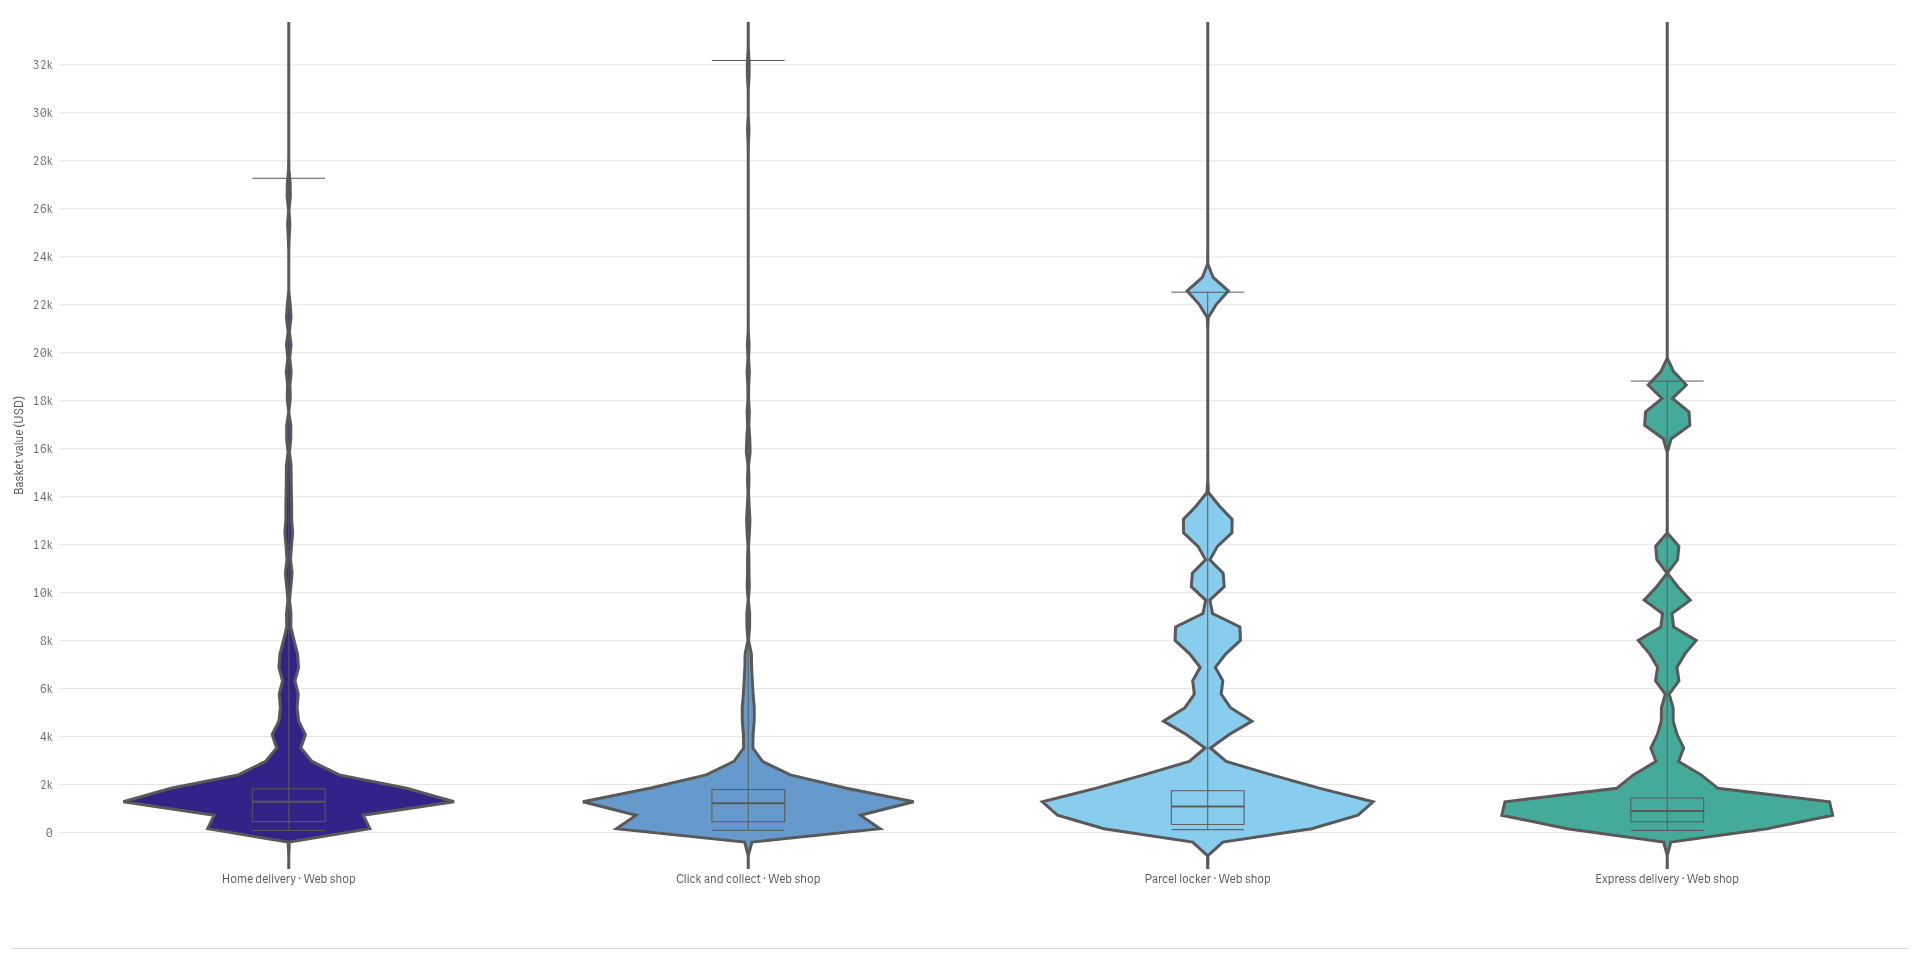
Tm Visualization Suite: Distribution Explorer shows the whole spread of a number on one Qlik sheet object. Violins and rainclouds show the shape of each group, a beeswarm shows every single value, a dot histogram counts values in bins and a cumulative curve shows how many fall below each level.
Click a group, a bin or a point to select the values behind it, and the rest of the sheet follows. The charts read your data and never change it. Very large data sets are shown as a density, with a note on how many values are drawn.
Analysts and BI leads who look beyond the average to the full spread of a number.
Good for
- Do customers in one channel spend very differently?
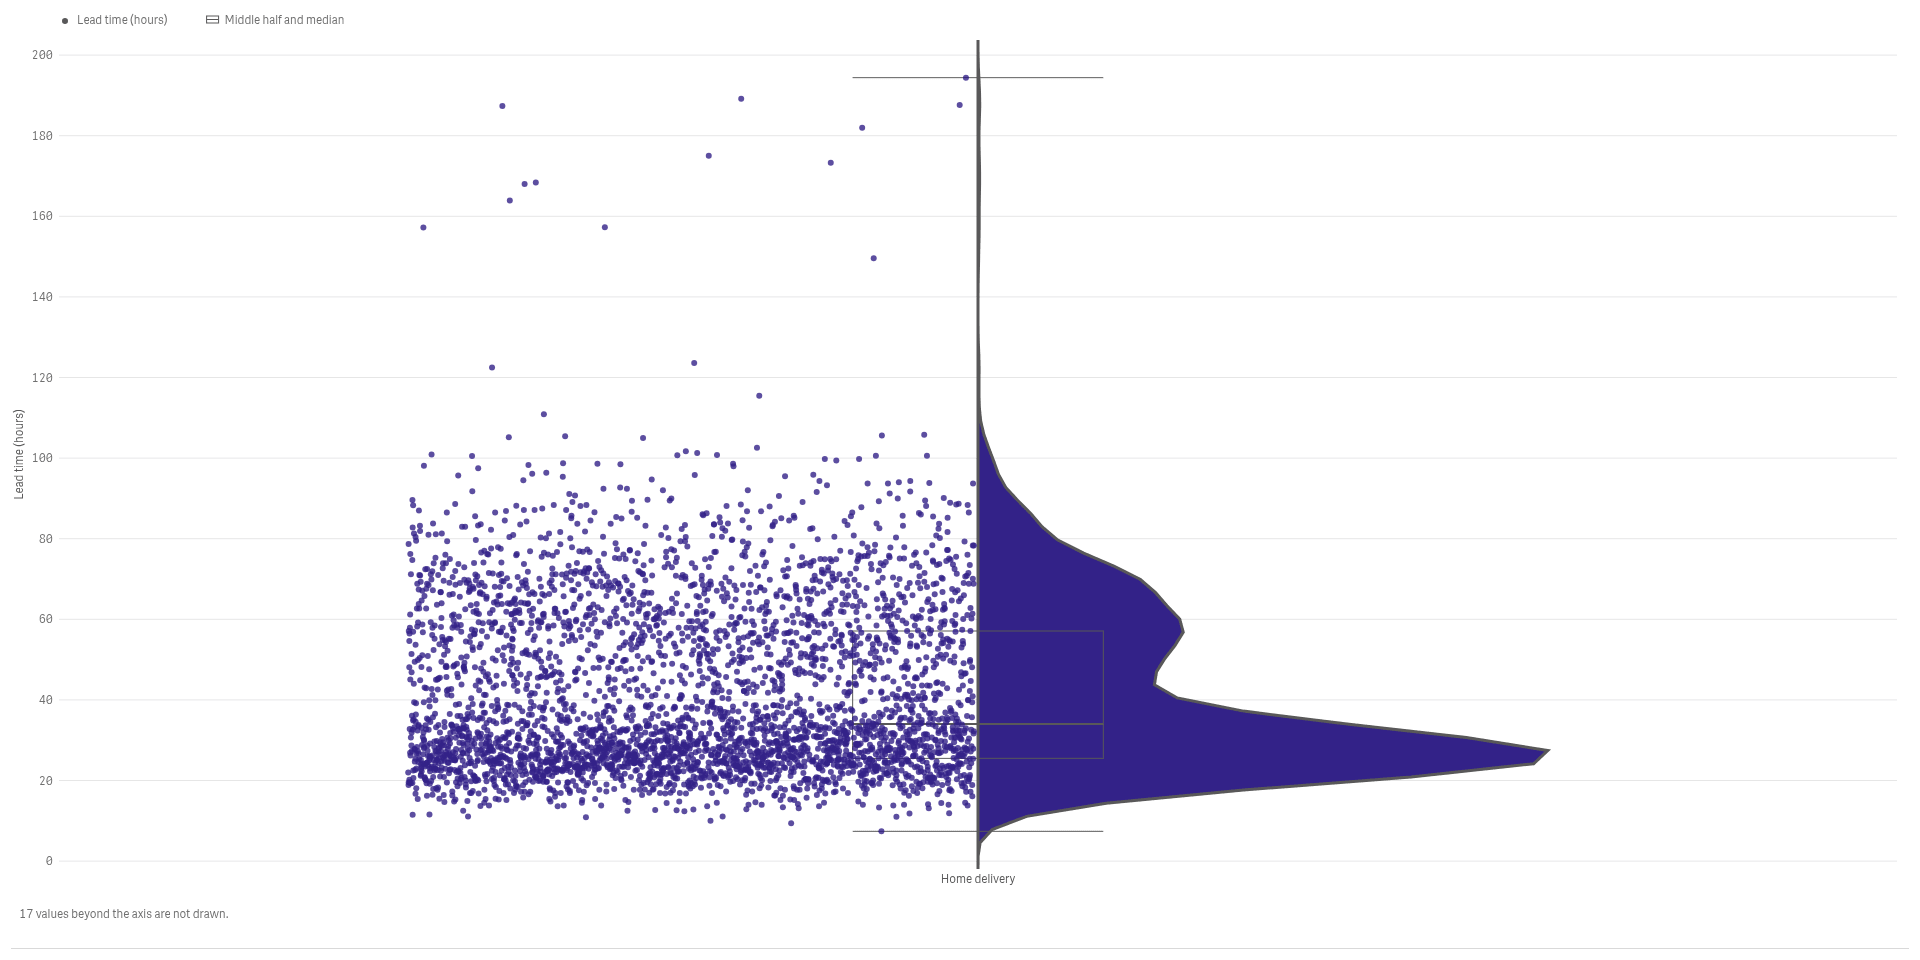
- How long do deliveries really take?
- Where are the outliers?
Key features
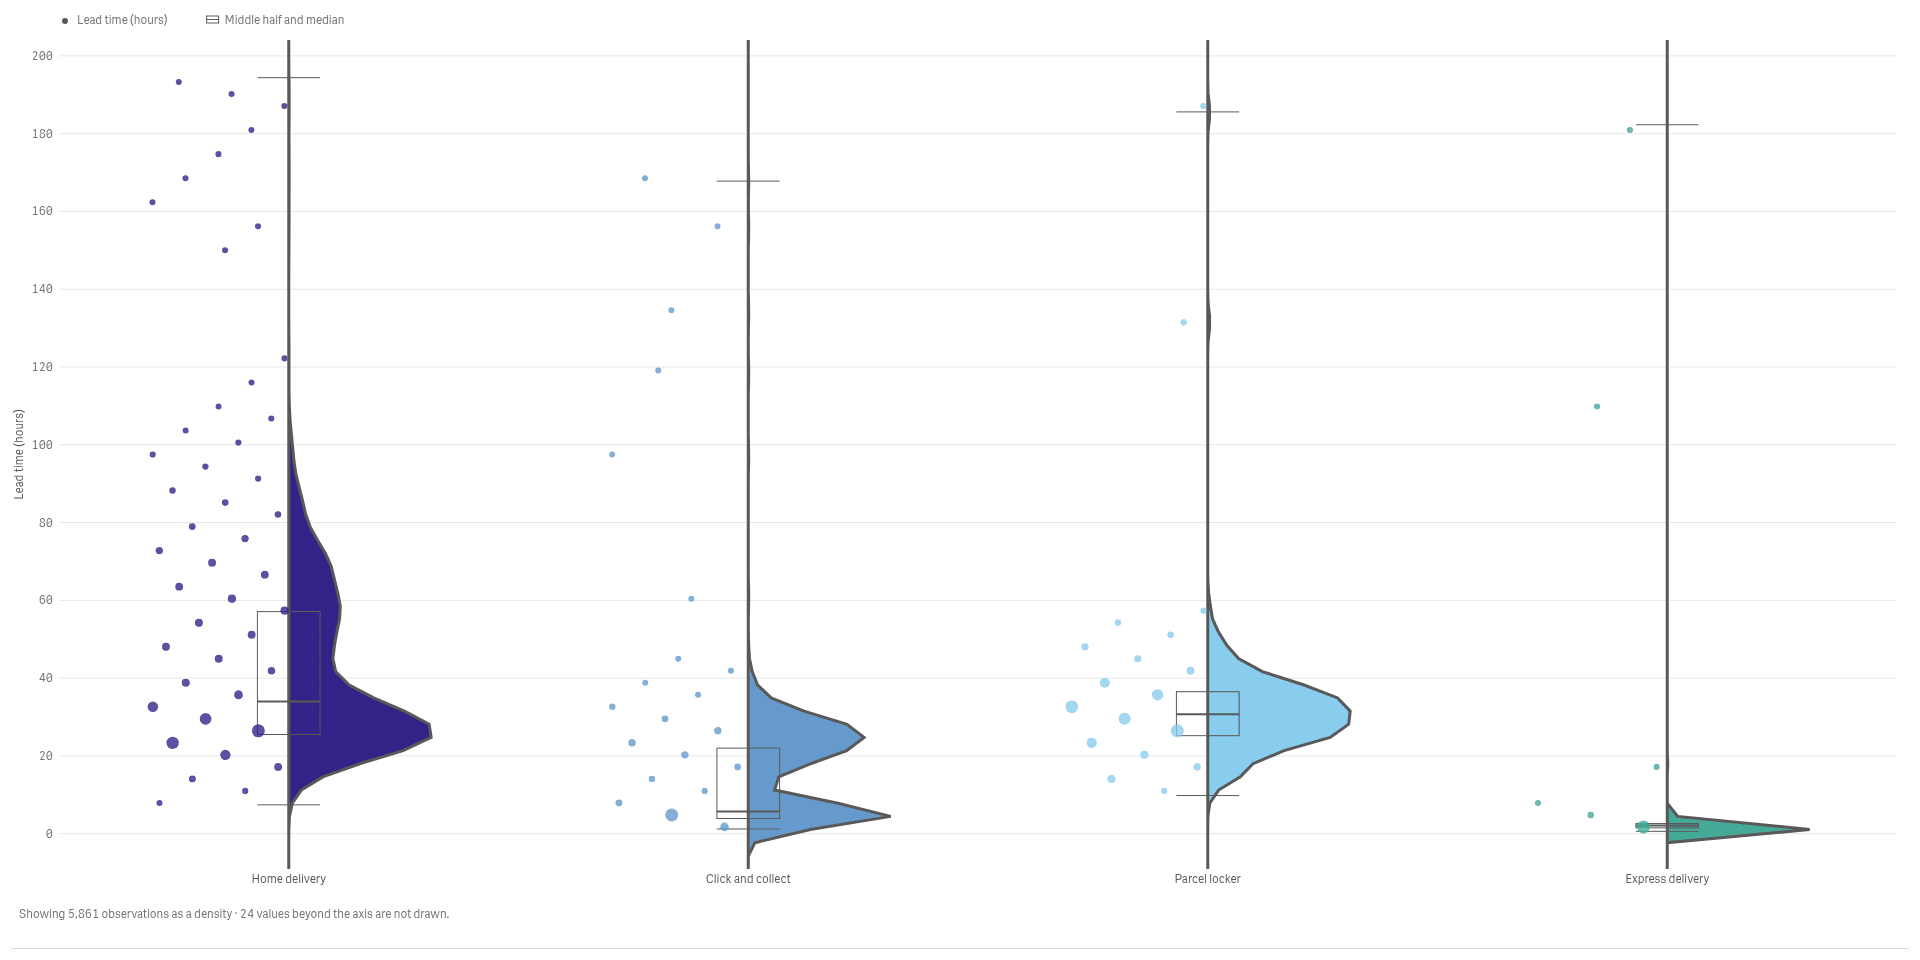
Add the raw values next to the shape
A raincloud draws the density, a box and the single points together, so shape and detail sit side by side.
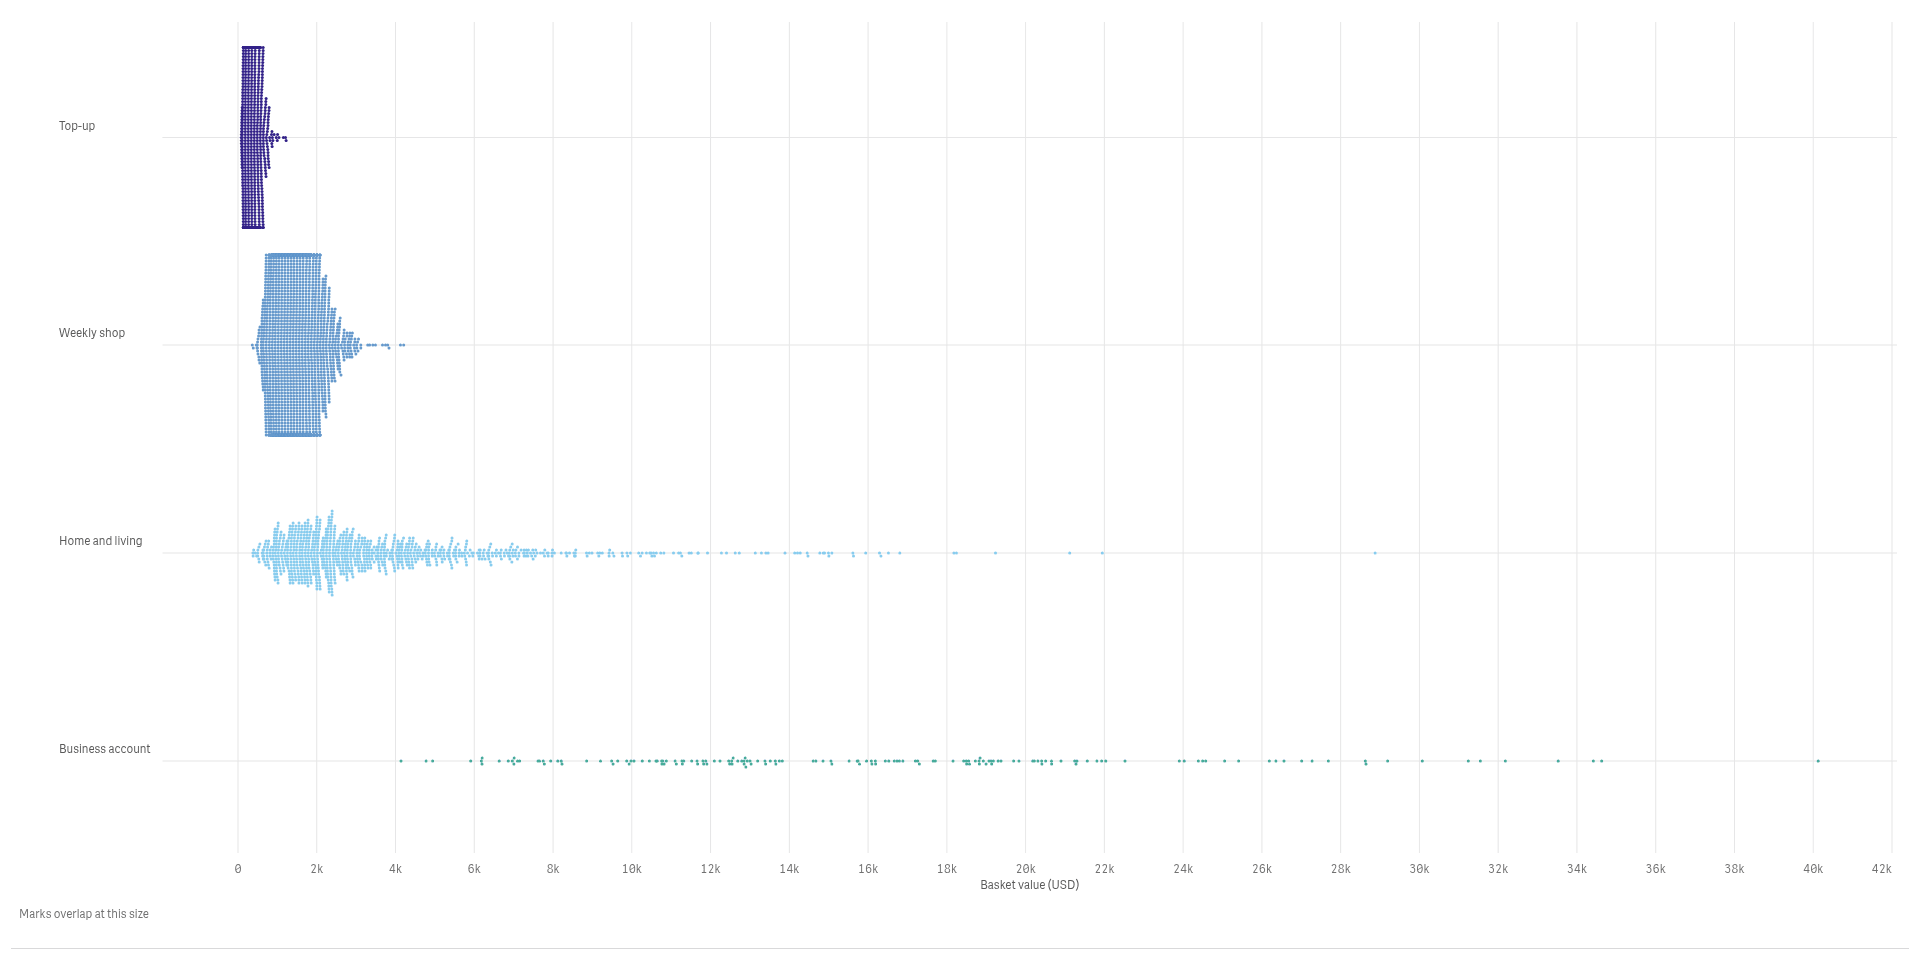
Show every single value
A beeswarm spreads the points so none hide behind another, and clusters and outliers stay visible.
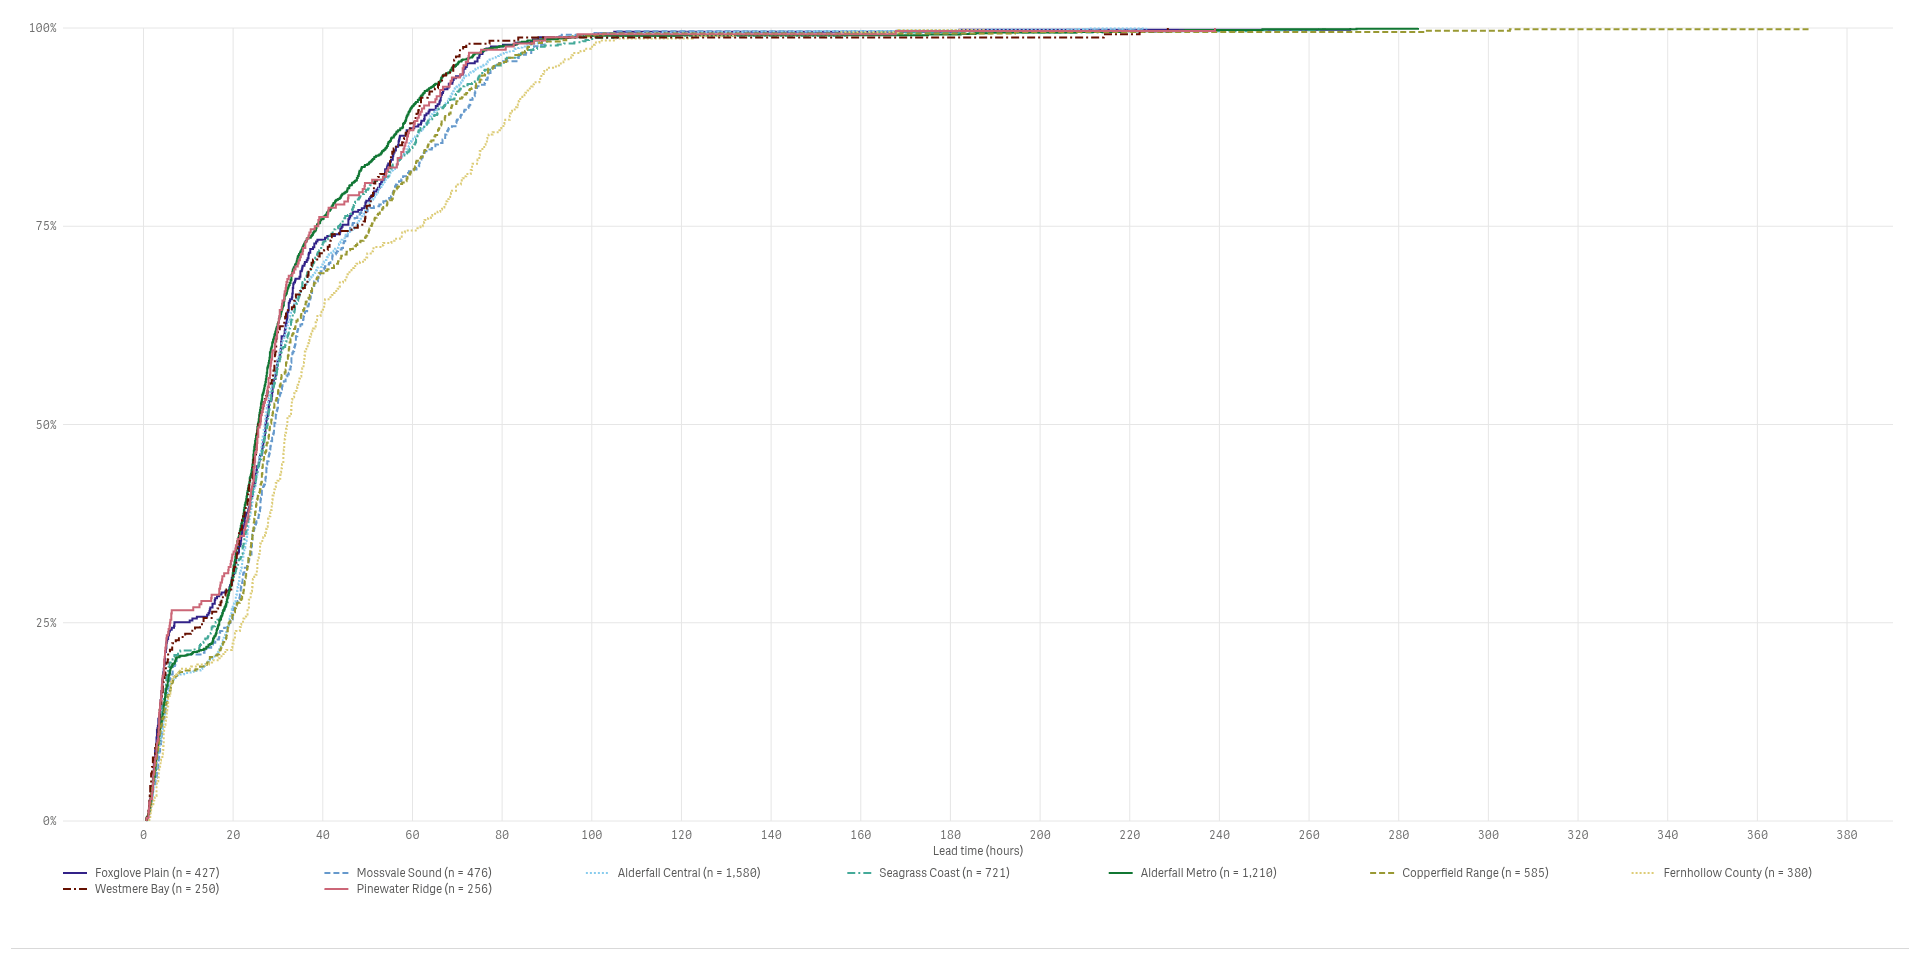
See how many fall below each level
A cumulative curve answers questions like how many deliveries arrive within 24 hours.
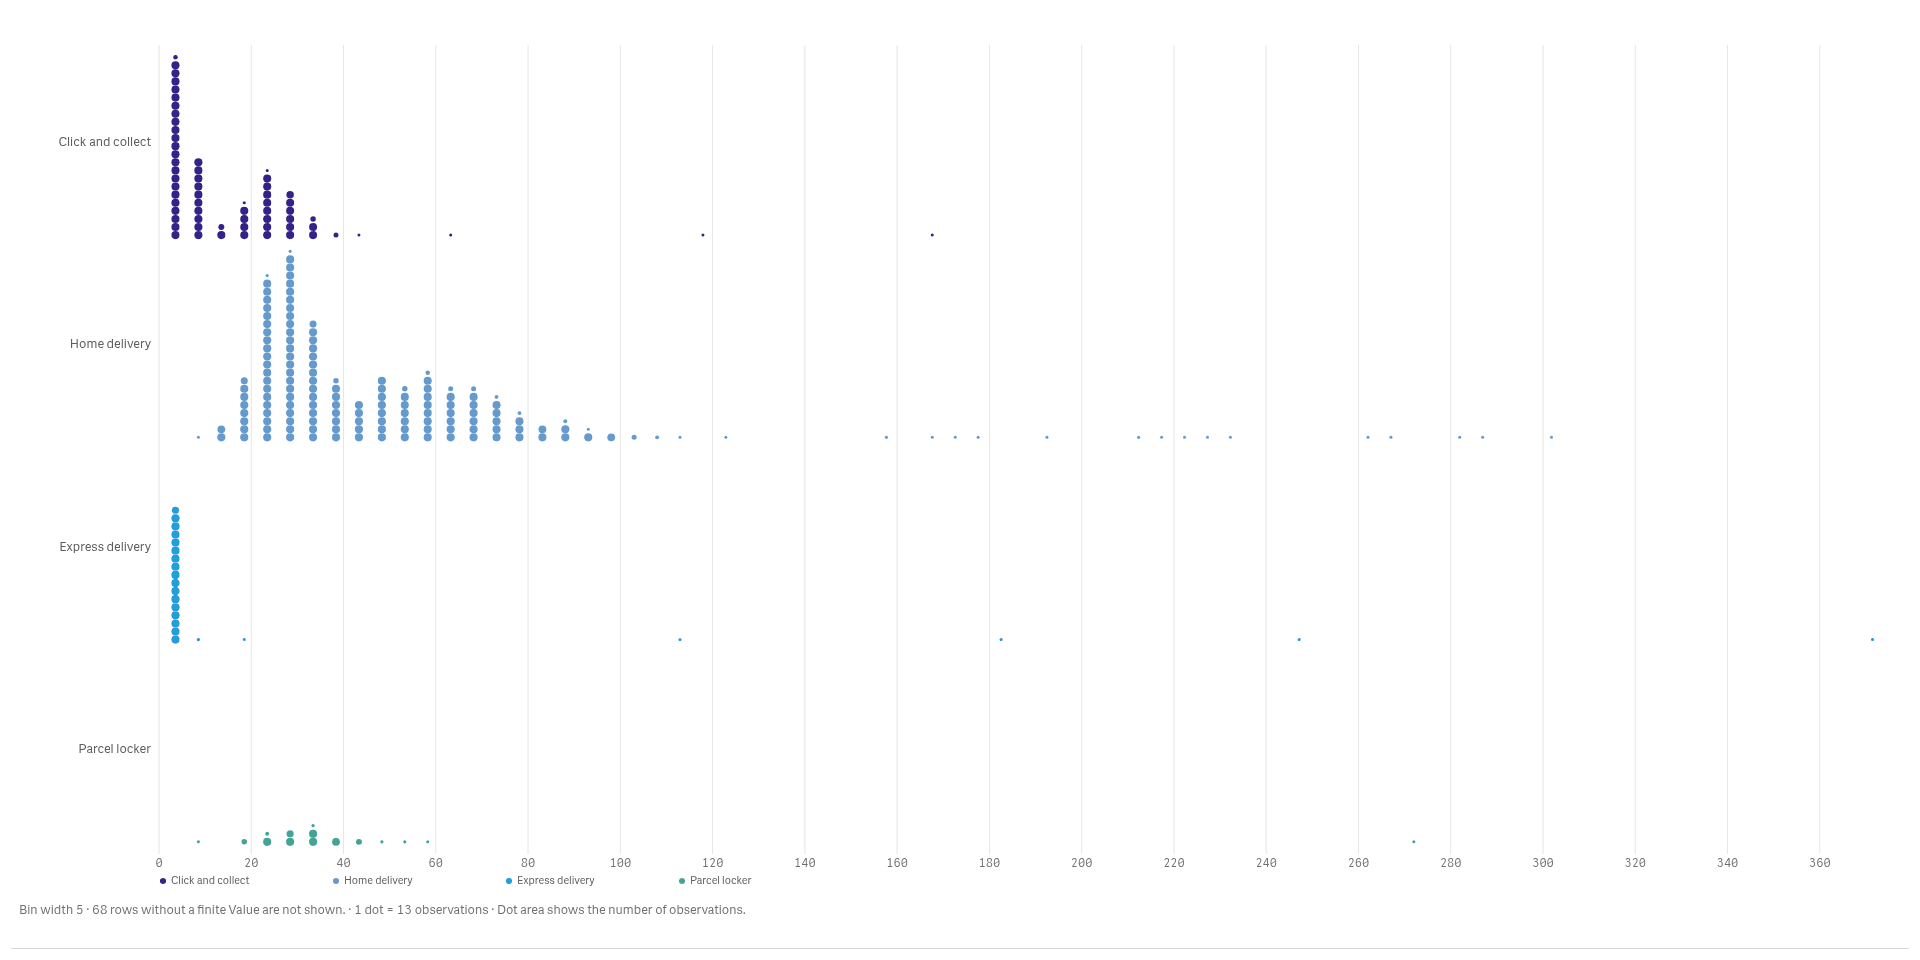
Count the values in every bin
A dot histogram stacks one dot per value in each bin, so you see the shape and the exact counts.
See it working
 View full size
 View full size
Try it
Download
Version 2.1.6
Extension
Demo App
Release page on GitHub with every file and its checksum.
Install
Install an extension in Qlik Cloud or client-managed Qlik Sense.
Set up
Install notes
No install notes for this Product. See the general install page.
Docs
Release notes
No release notes yet.
How to get a license
- Review the Product Listing and its documentation.
- E-mail us the Product name, the name of your Qlik Cloud tenant and the number of users.
- We reply to you with the next step.