
Tm Visualization Suite
Which chart answers the question you ask of your data?
Ten chart families for Qlik Cloud, each built for a different question about time, spread, flow or parts.
License the Products one at a time or as the whole Family.
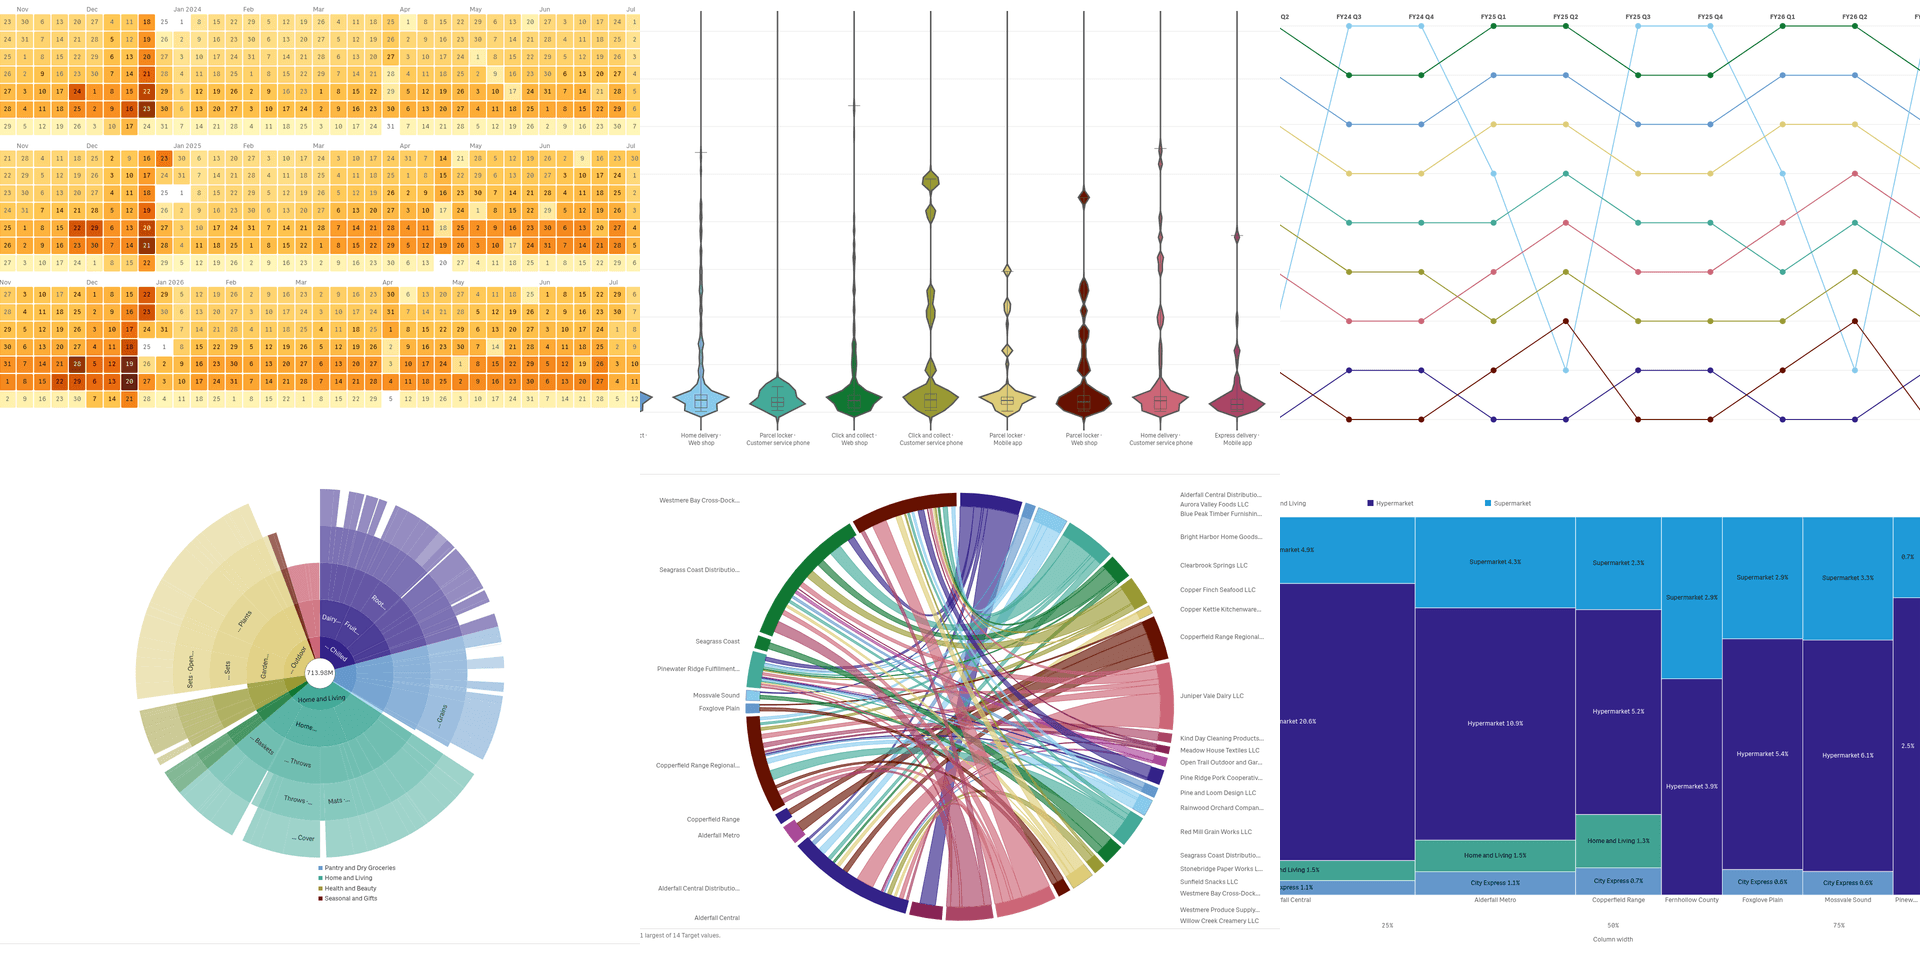 View full size
Explore the Family
Tm Visualization Suite adds ten chart families to Qlik Cloud. Each family answers a different kind of question: time patterns, spread of values, comparisons, links and flows, hierarchies, many measures at once, process paths, places on a map, plan against actual, and the parts of a whole.
Every family has several chart types that share one data setup, so you can switch the chart without rebuilding the sheet. A click on a mark selects the data behind it, and the rest of the sheet follows. Install one family, several or all ten. The charts read your data and never change it.
Analysts and BI leads who build Qlik sheets and need charts that a native Qlik chart does not draw.
Good for
- Which chart fits my question about time, spread or flow?
- How do I show a process, a hierarchy or a map in Qlik?
- Can one set of charts cover my whole analytics team?
Key features
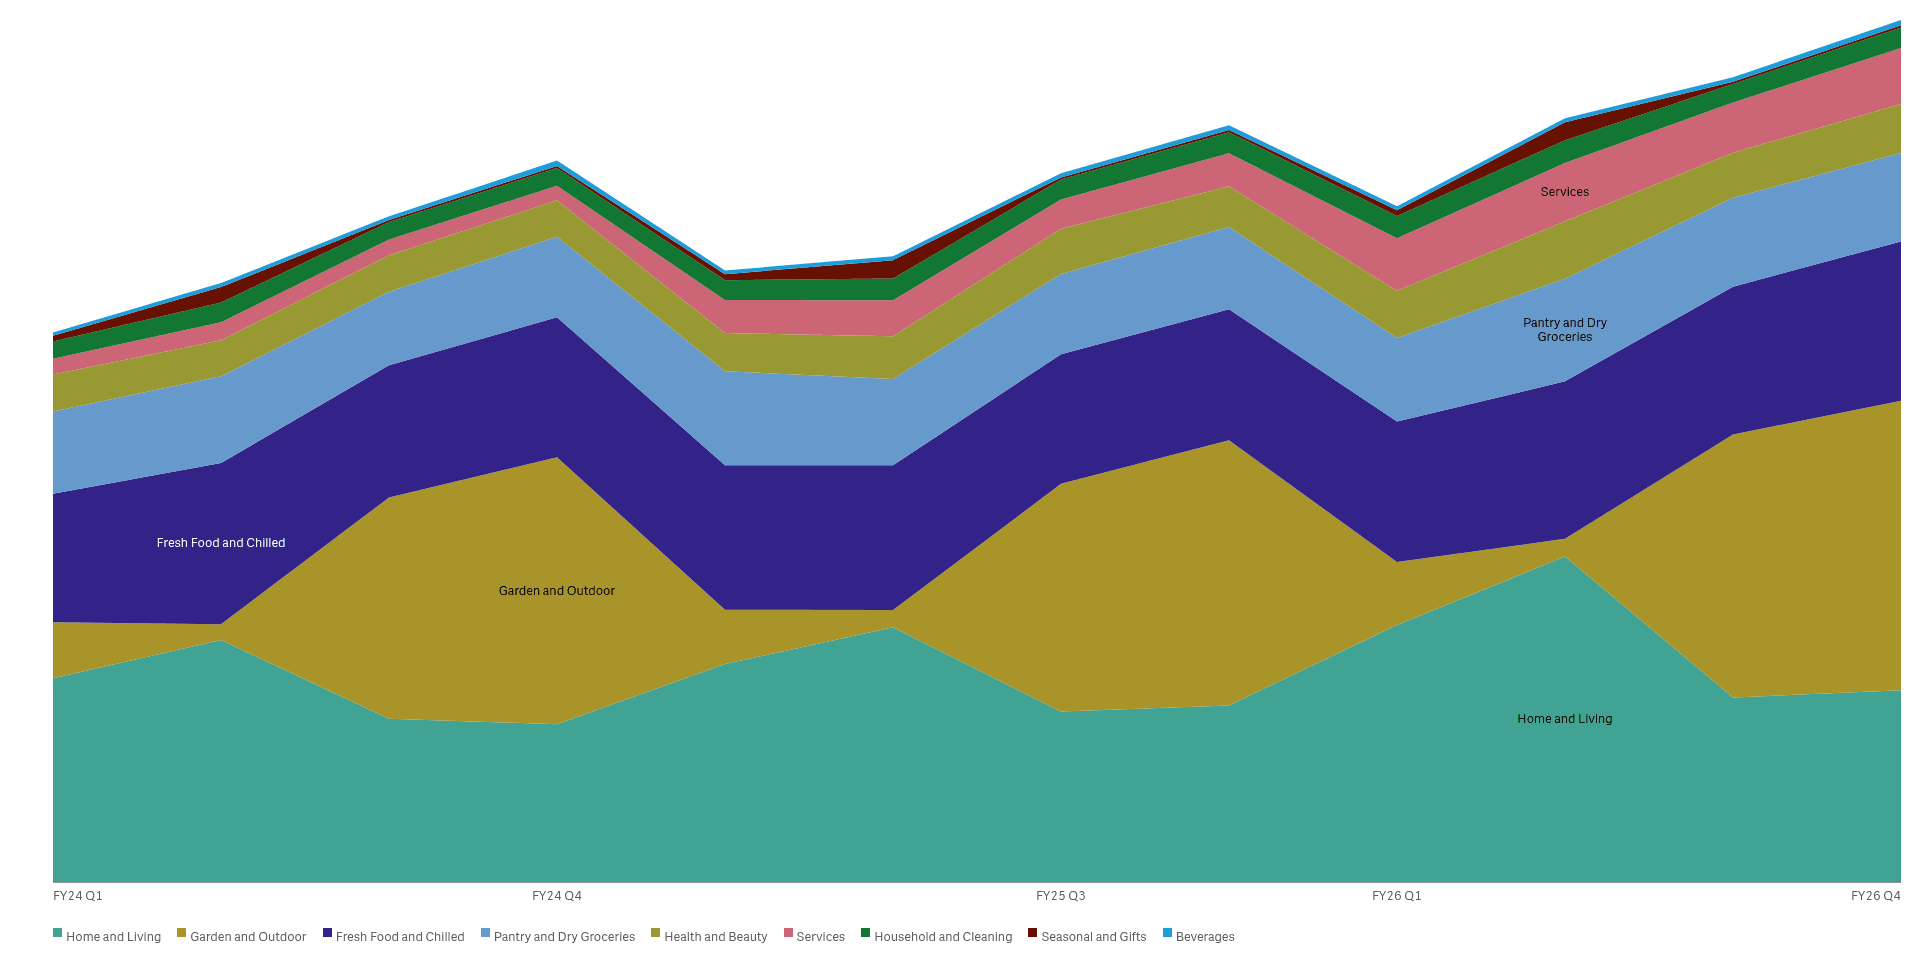
Follow time and the seasons
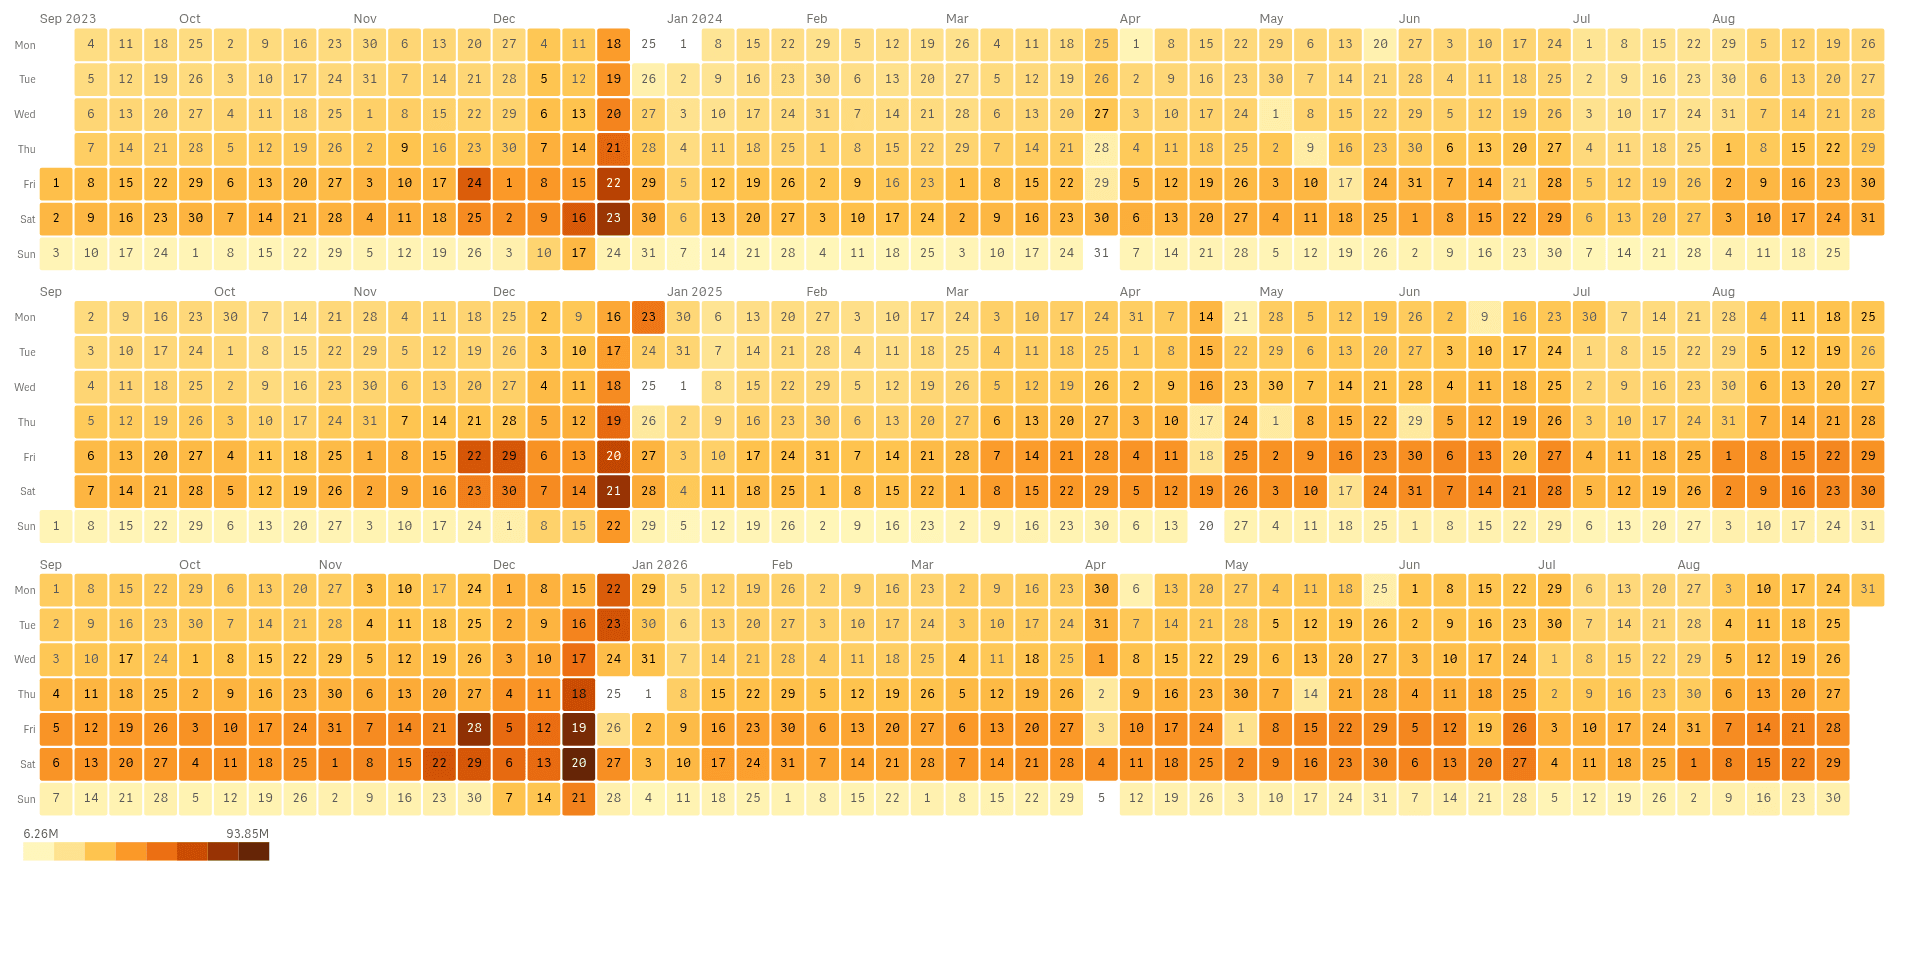
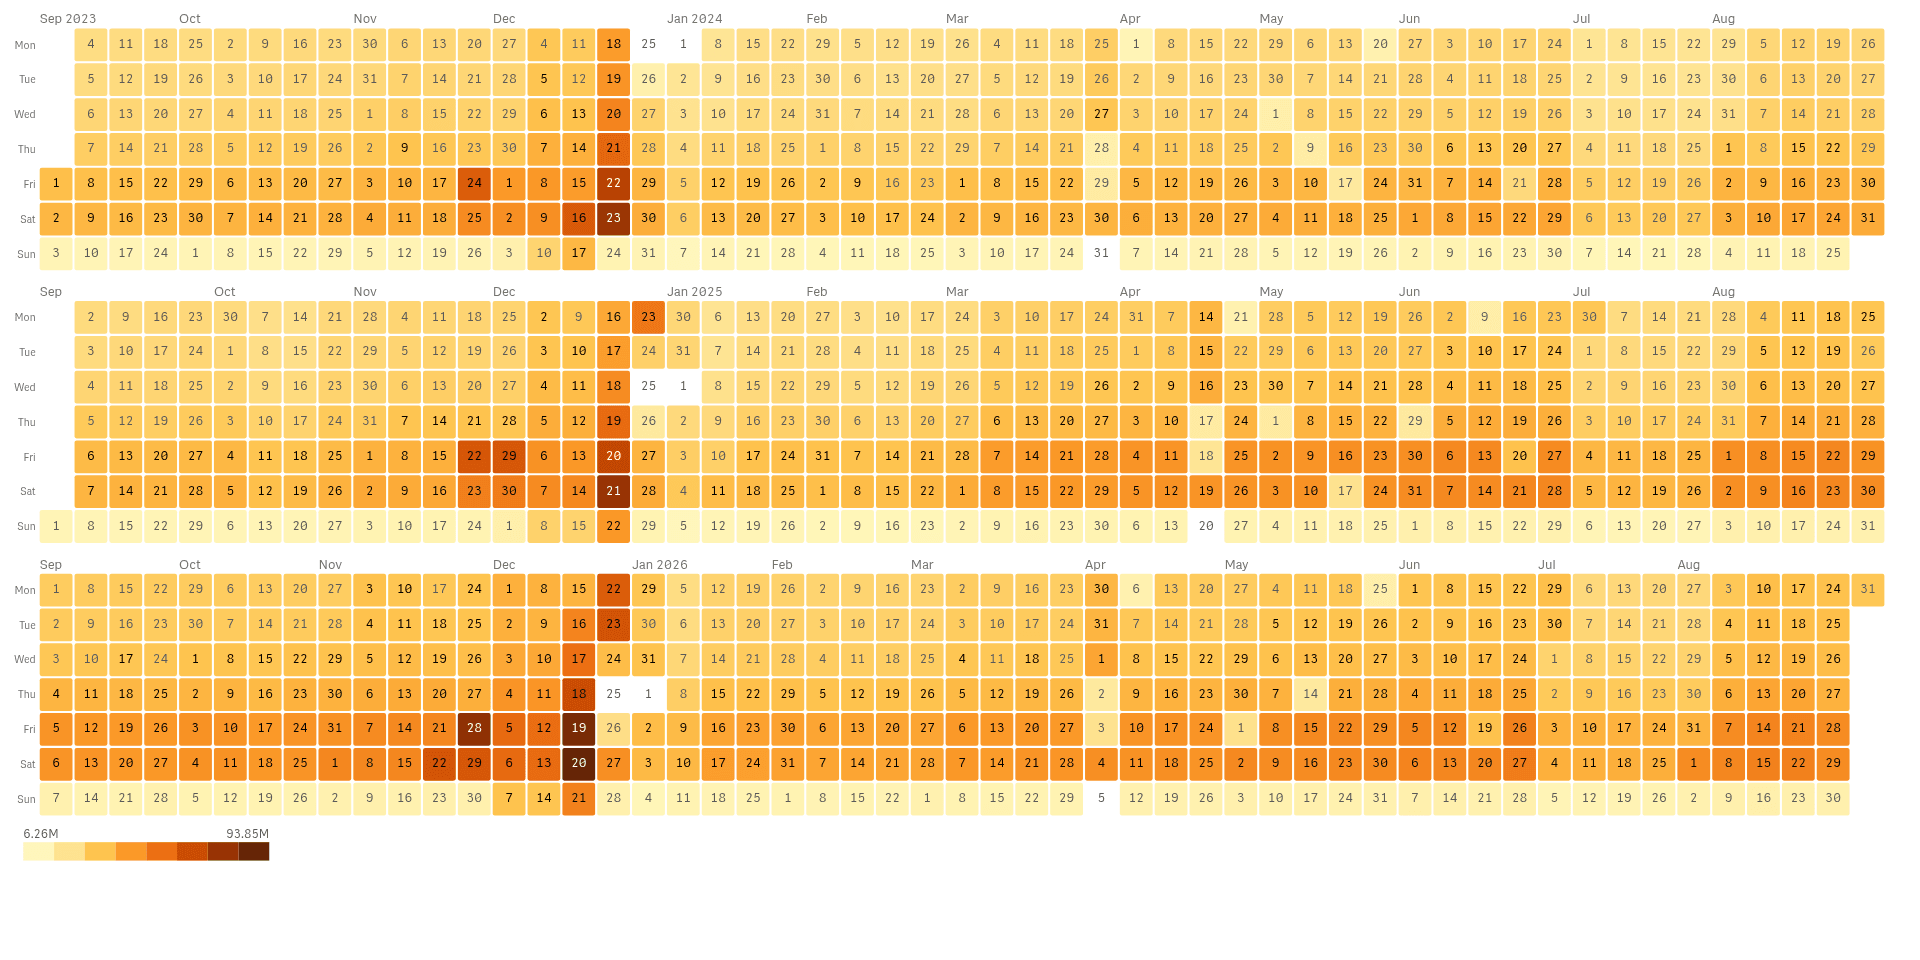
Calendar heatmaps, ridgelines and streamgraphs show the rhythm of your numbers over days, weeks and years.
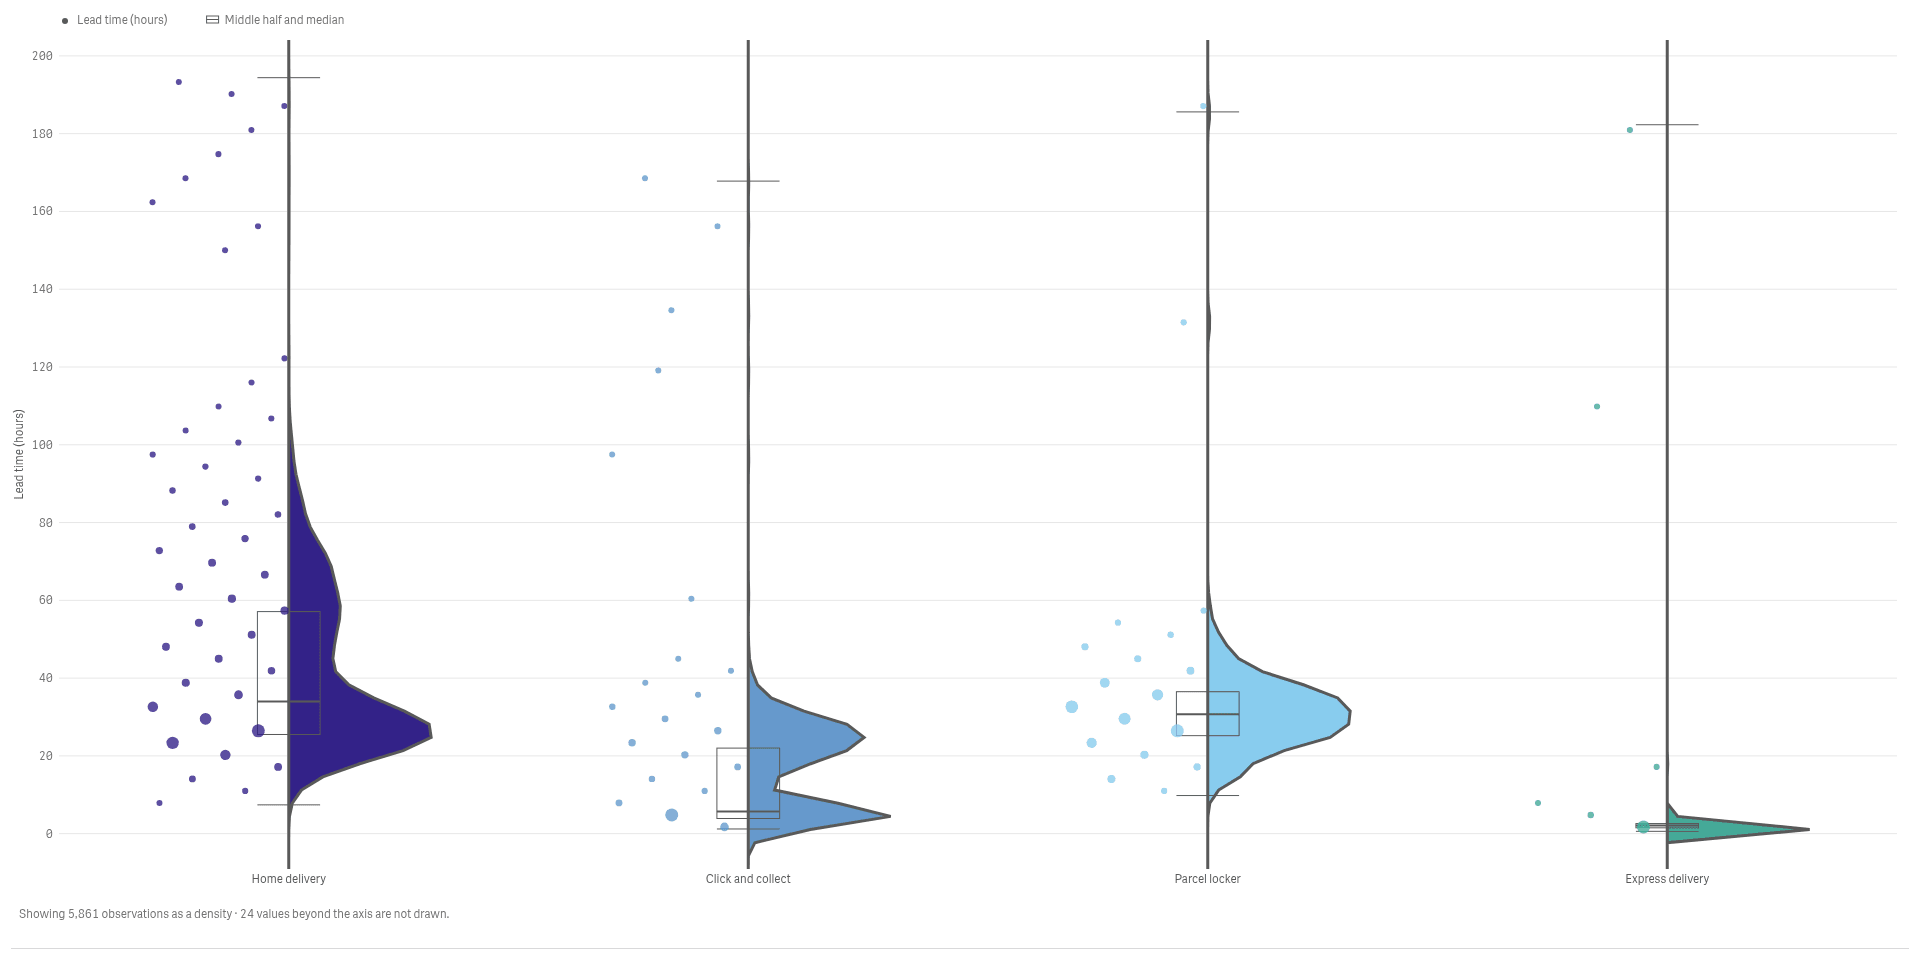
See the whole spread, not just the average
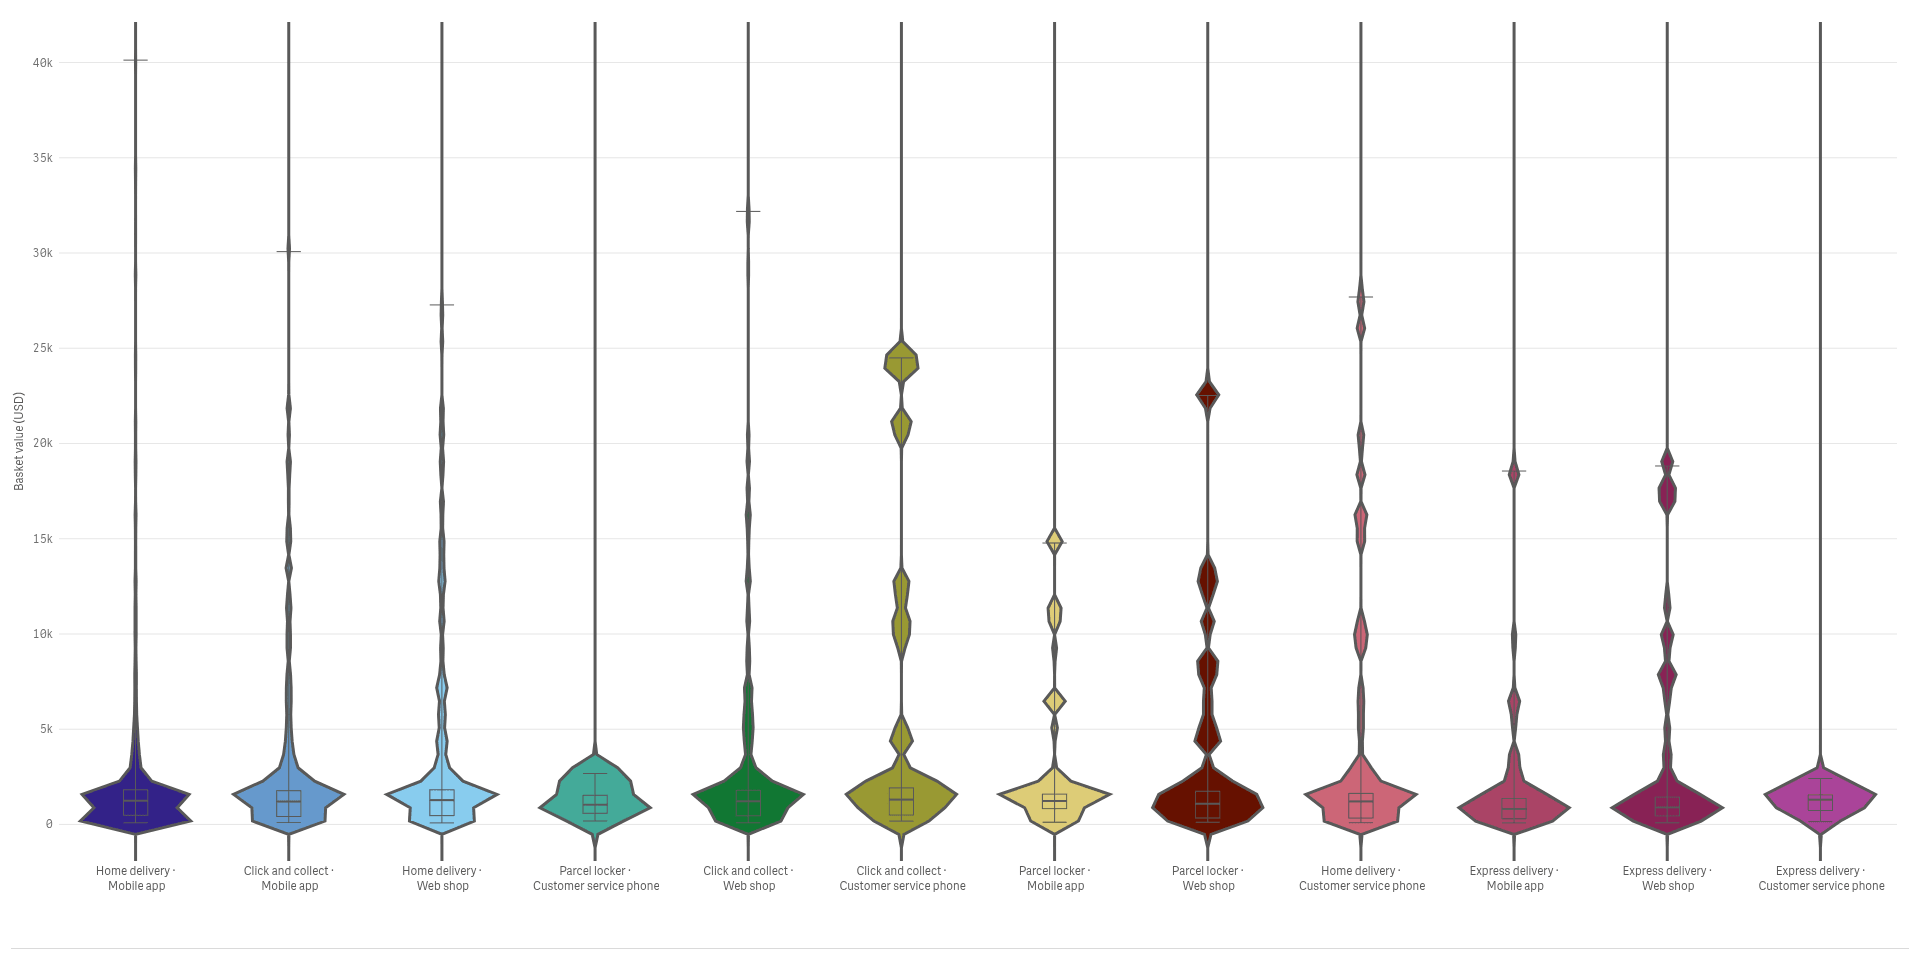
Violins, rainclouds and beeswarms show how values spread inside and between groups.
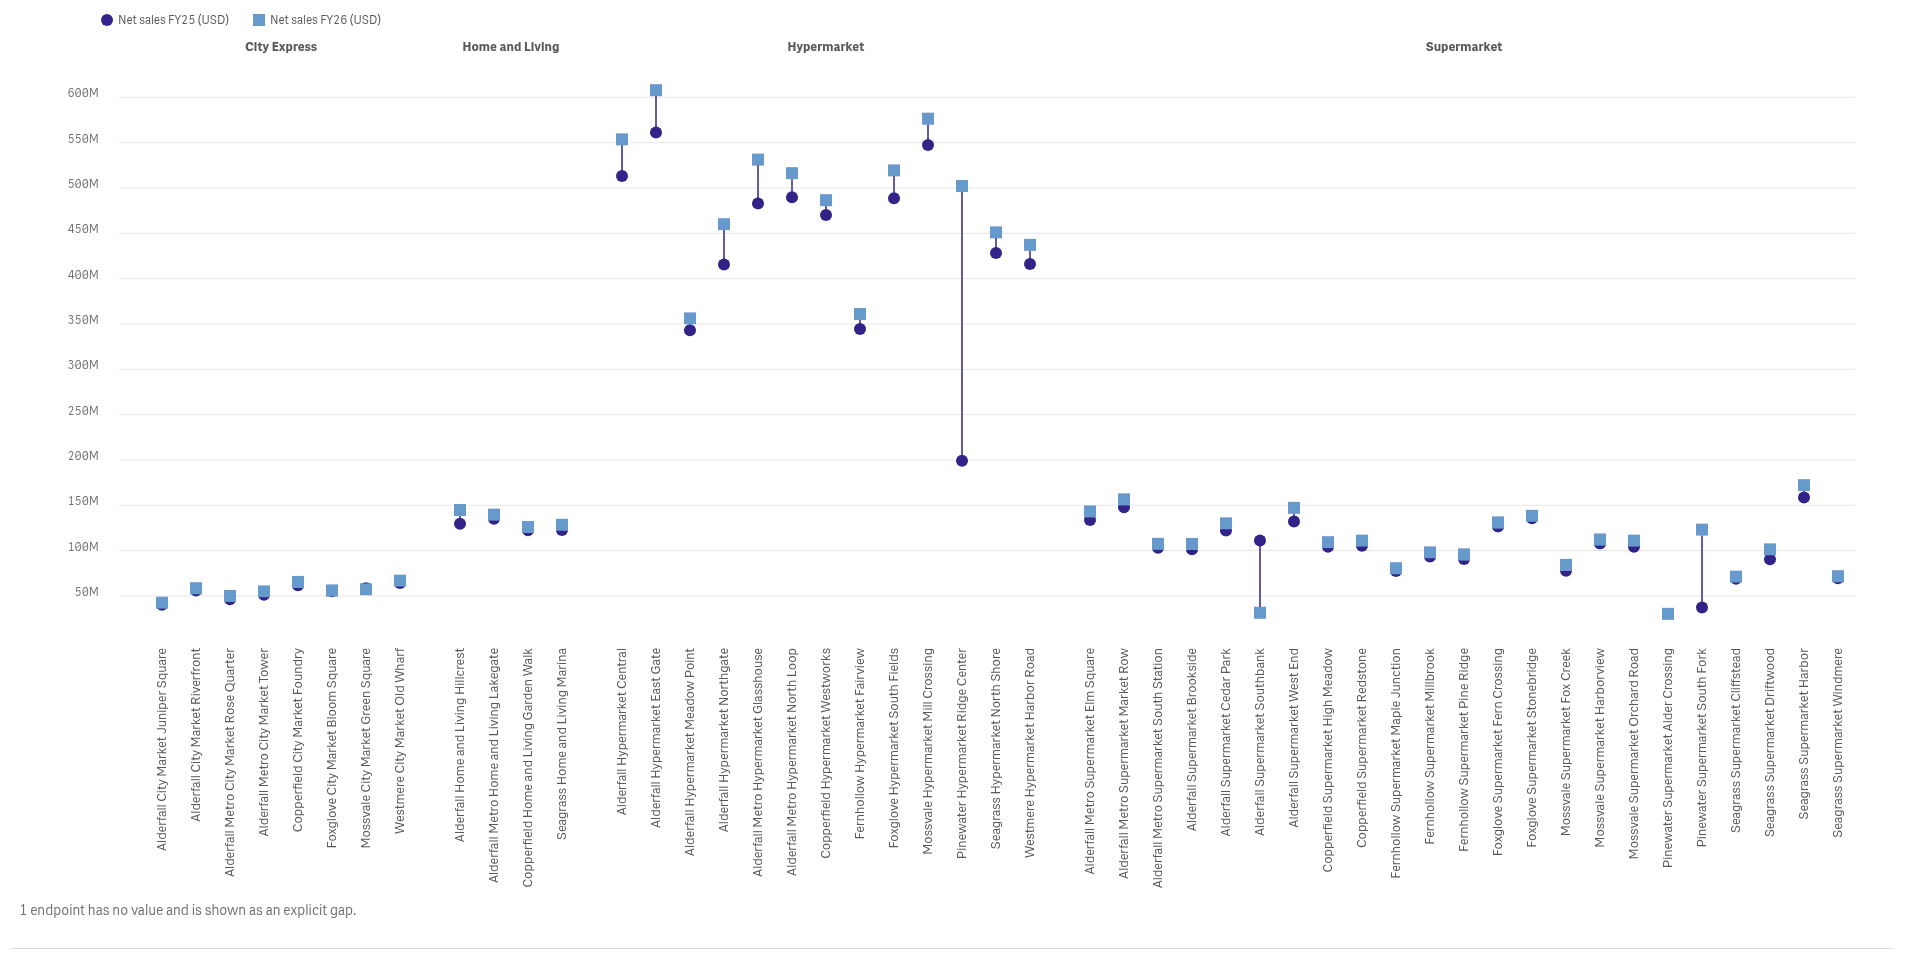
Compare categories, ranges and ranks
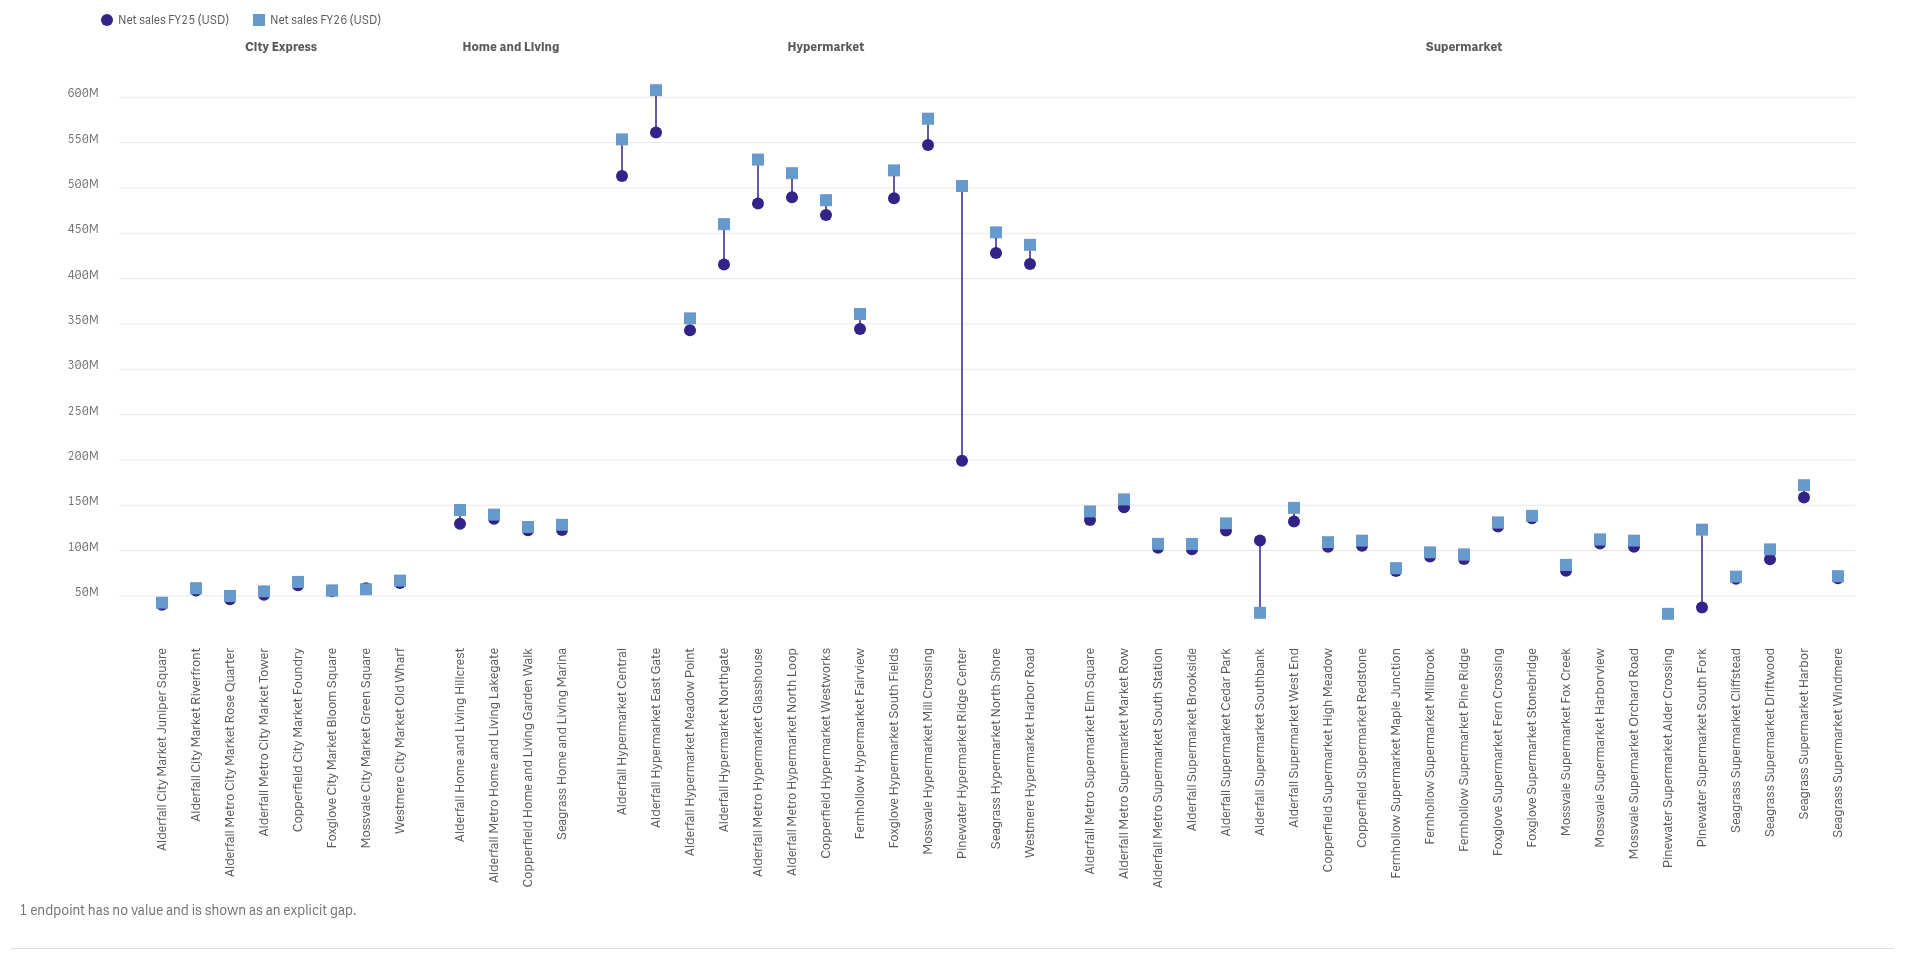
Dumbbells, dot plots and bump charts show who changed, by how much and who overtook whom.
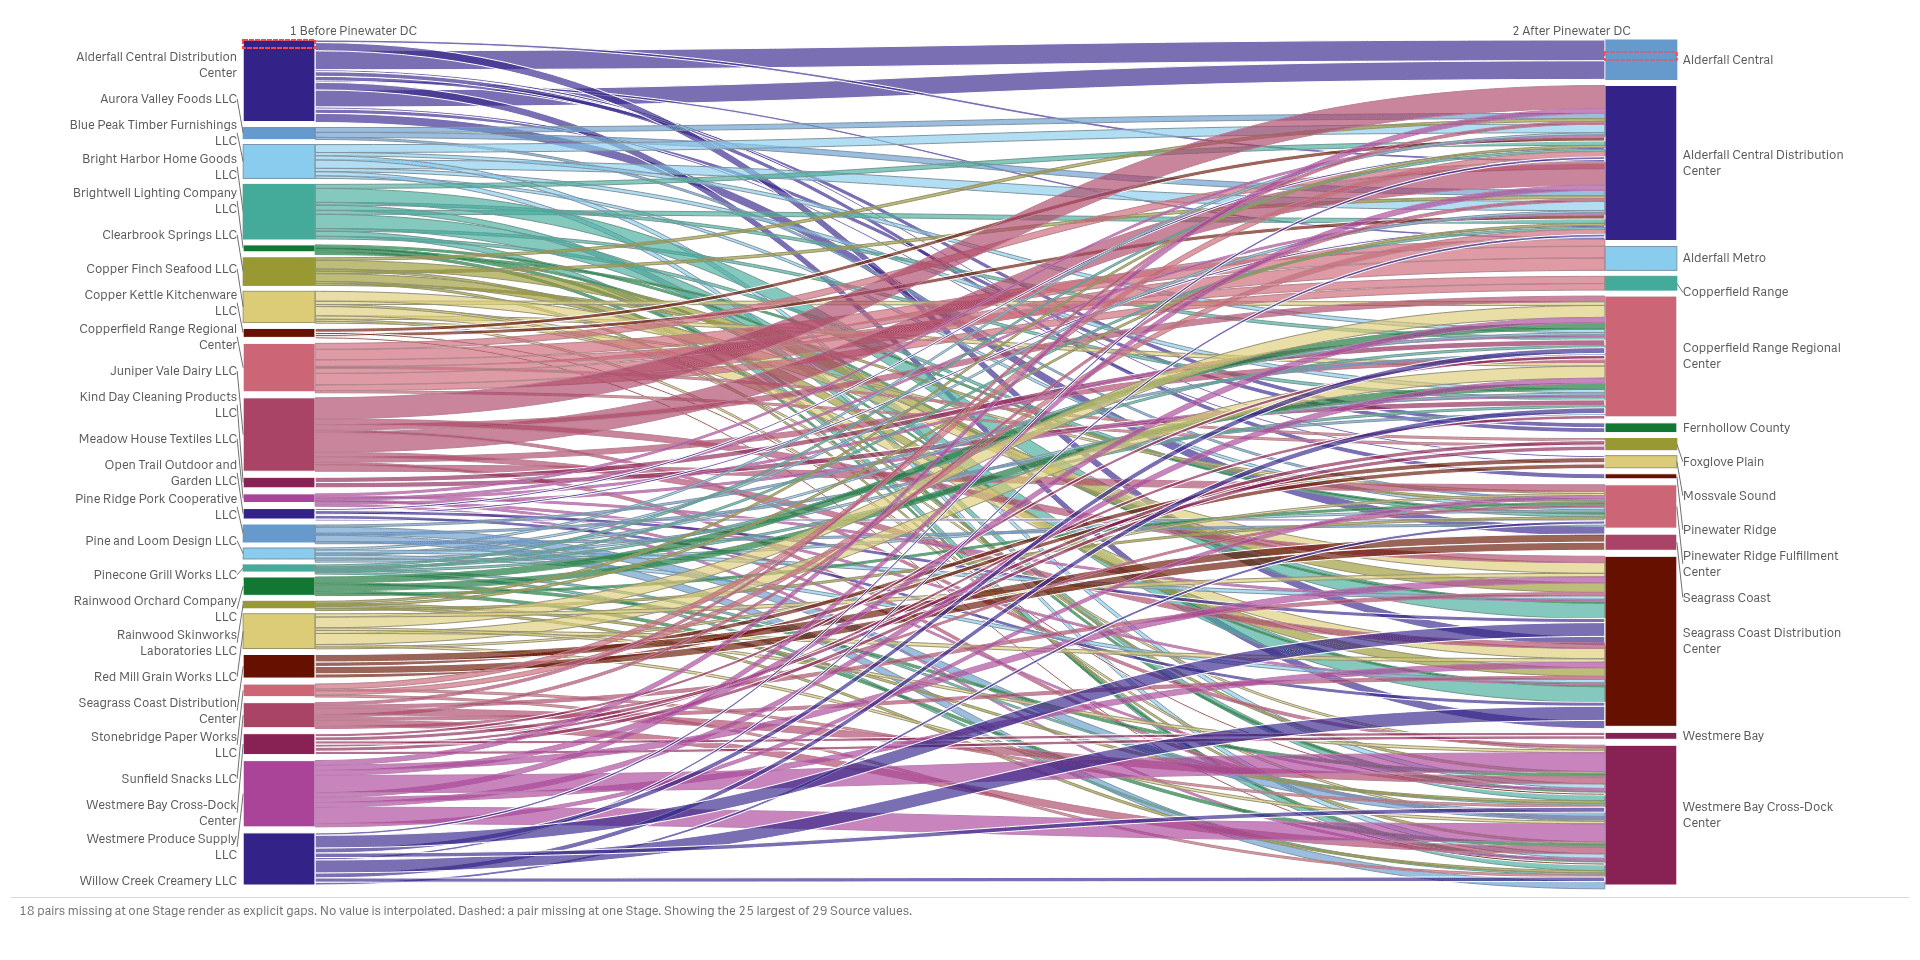
Follow flows and links
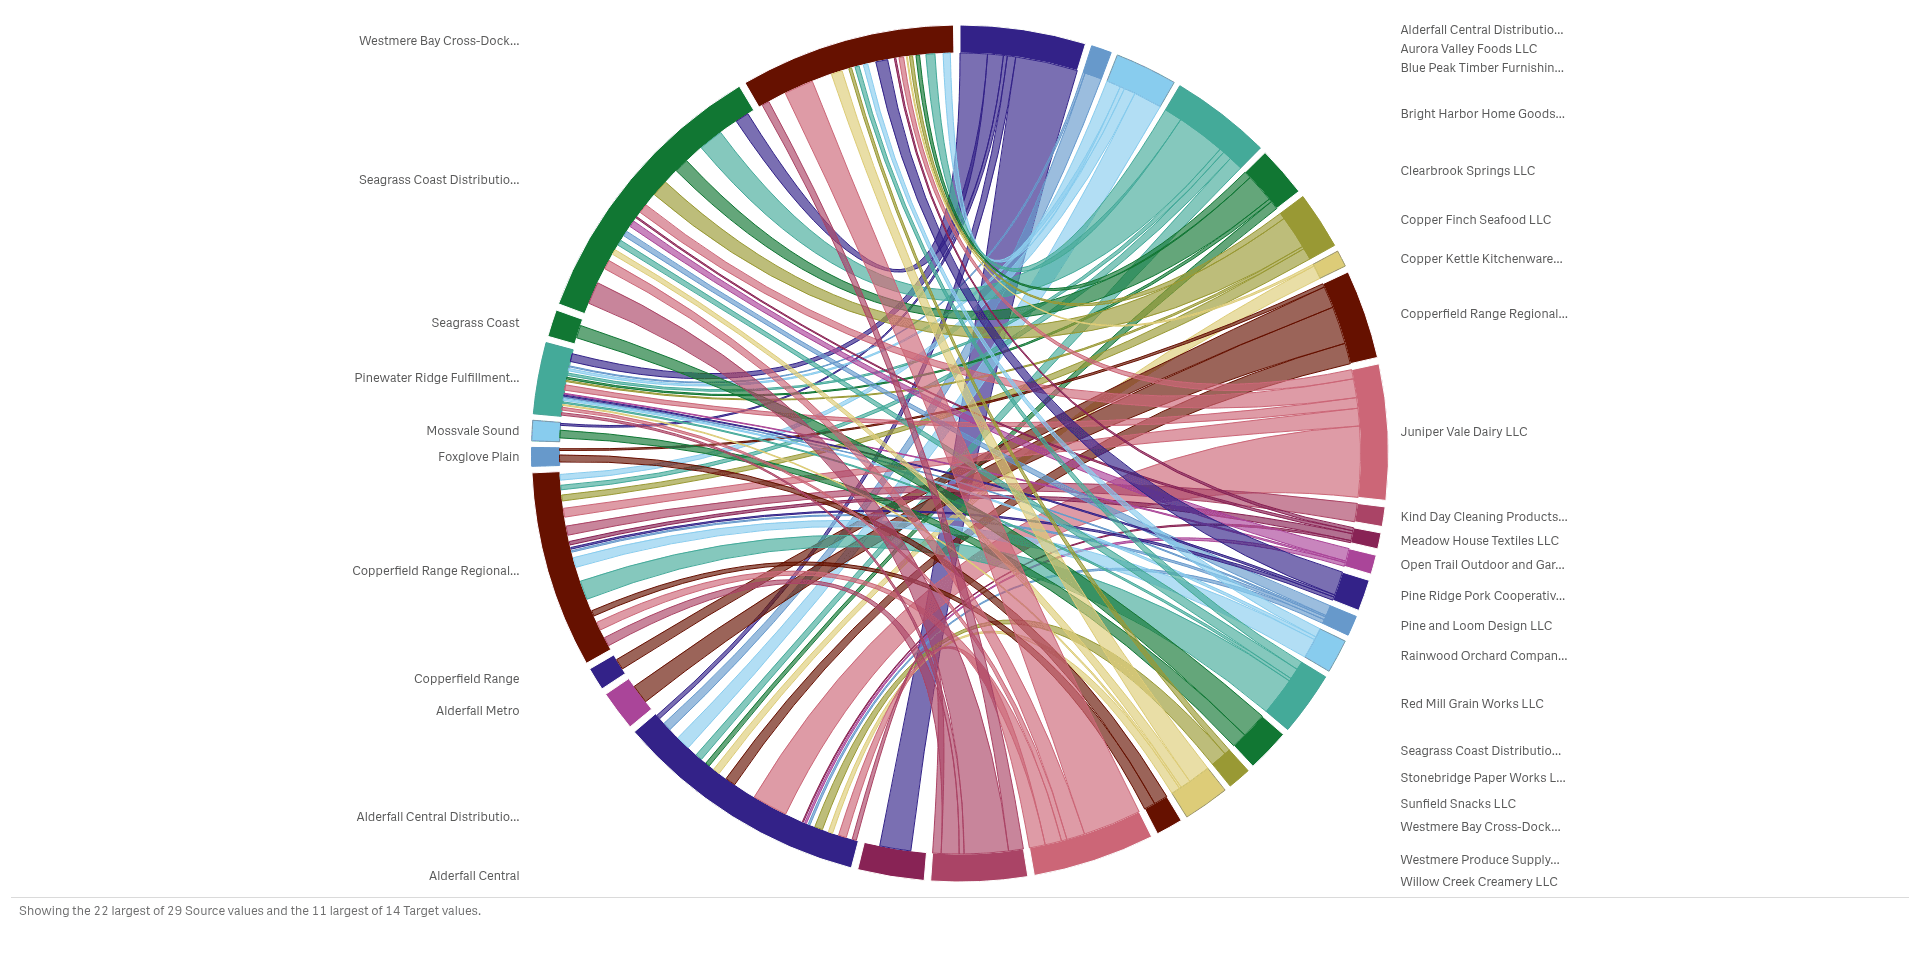
Chords, alluvial diagrams and networks show who connects to whom, and how strong the link is.
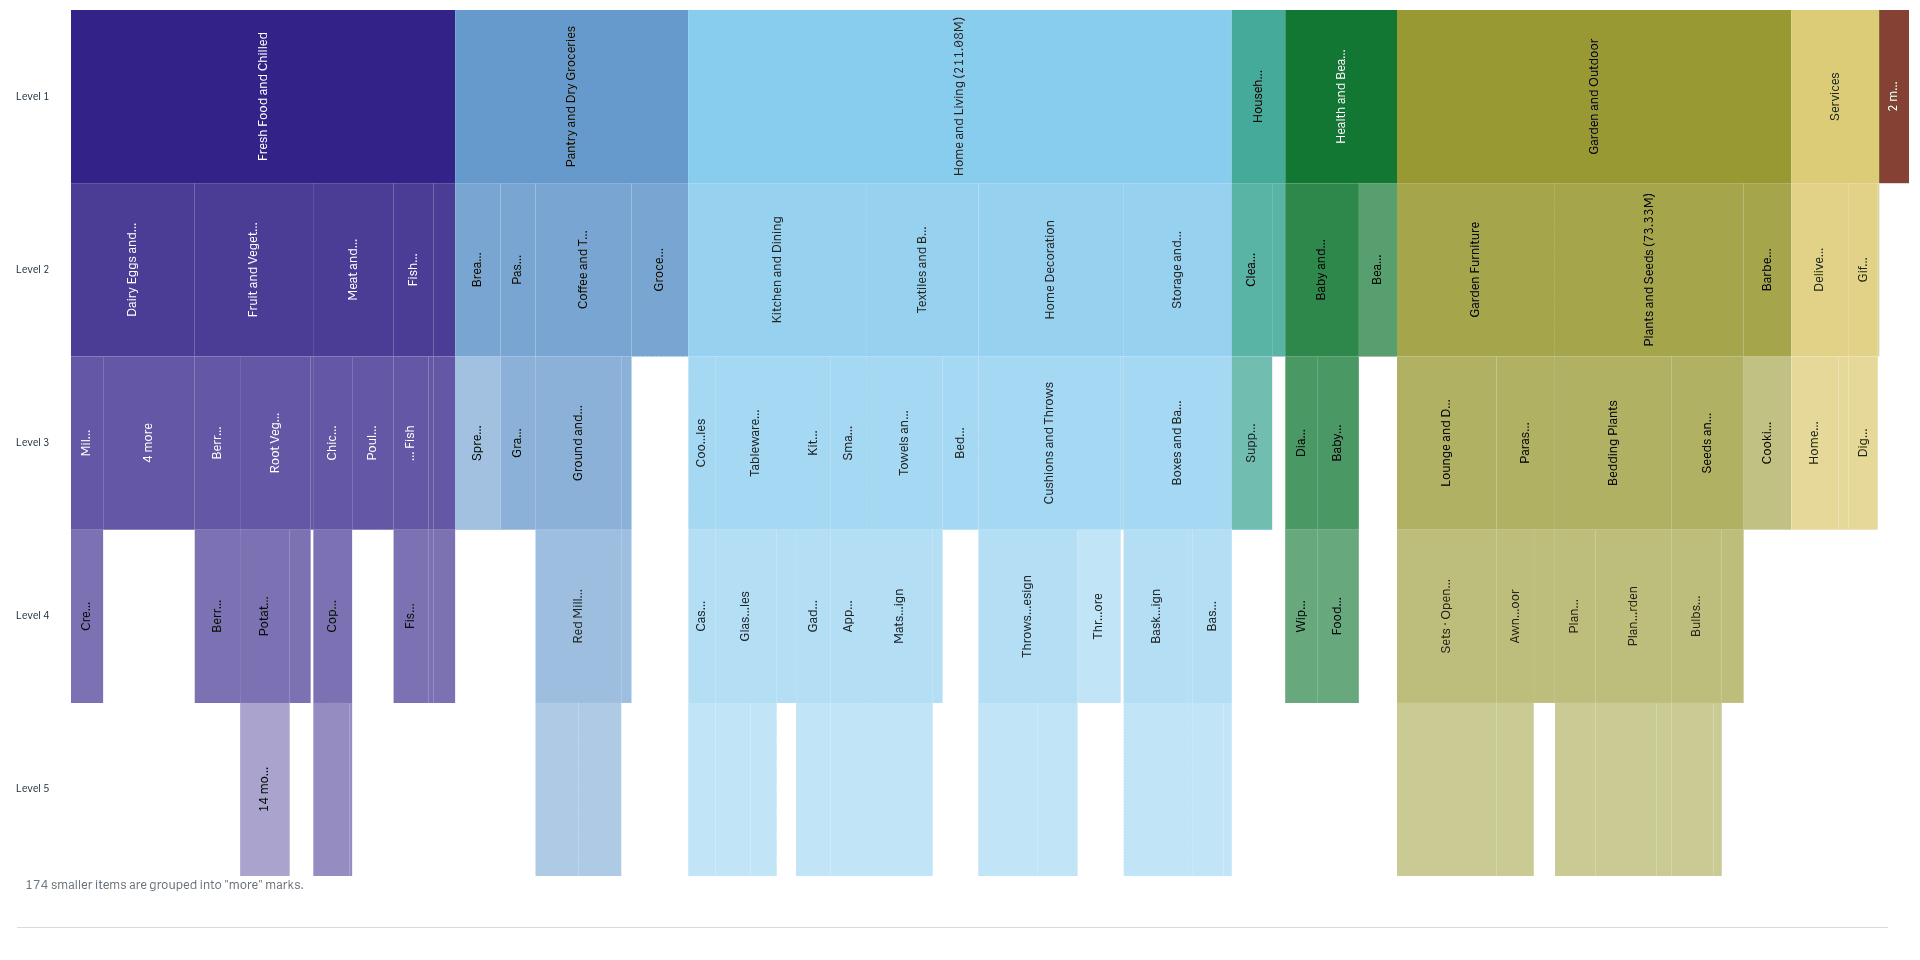
Break a total into levels
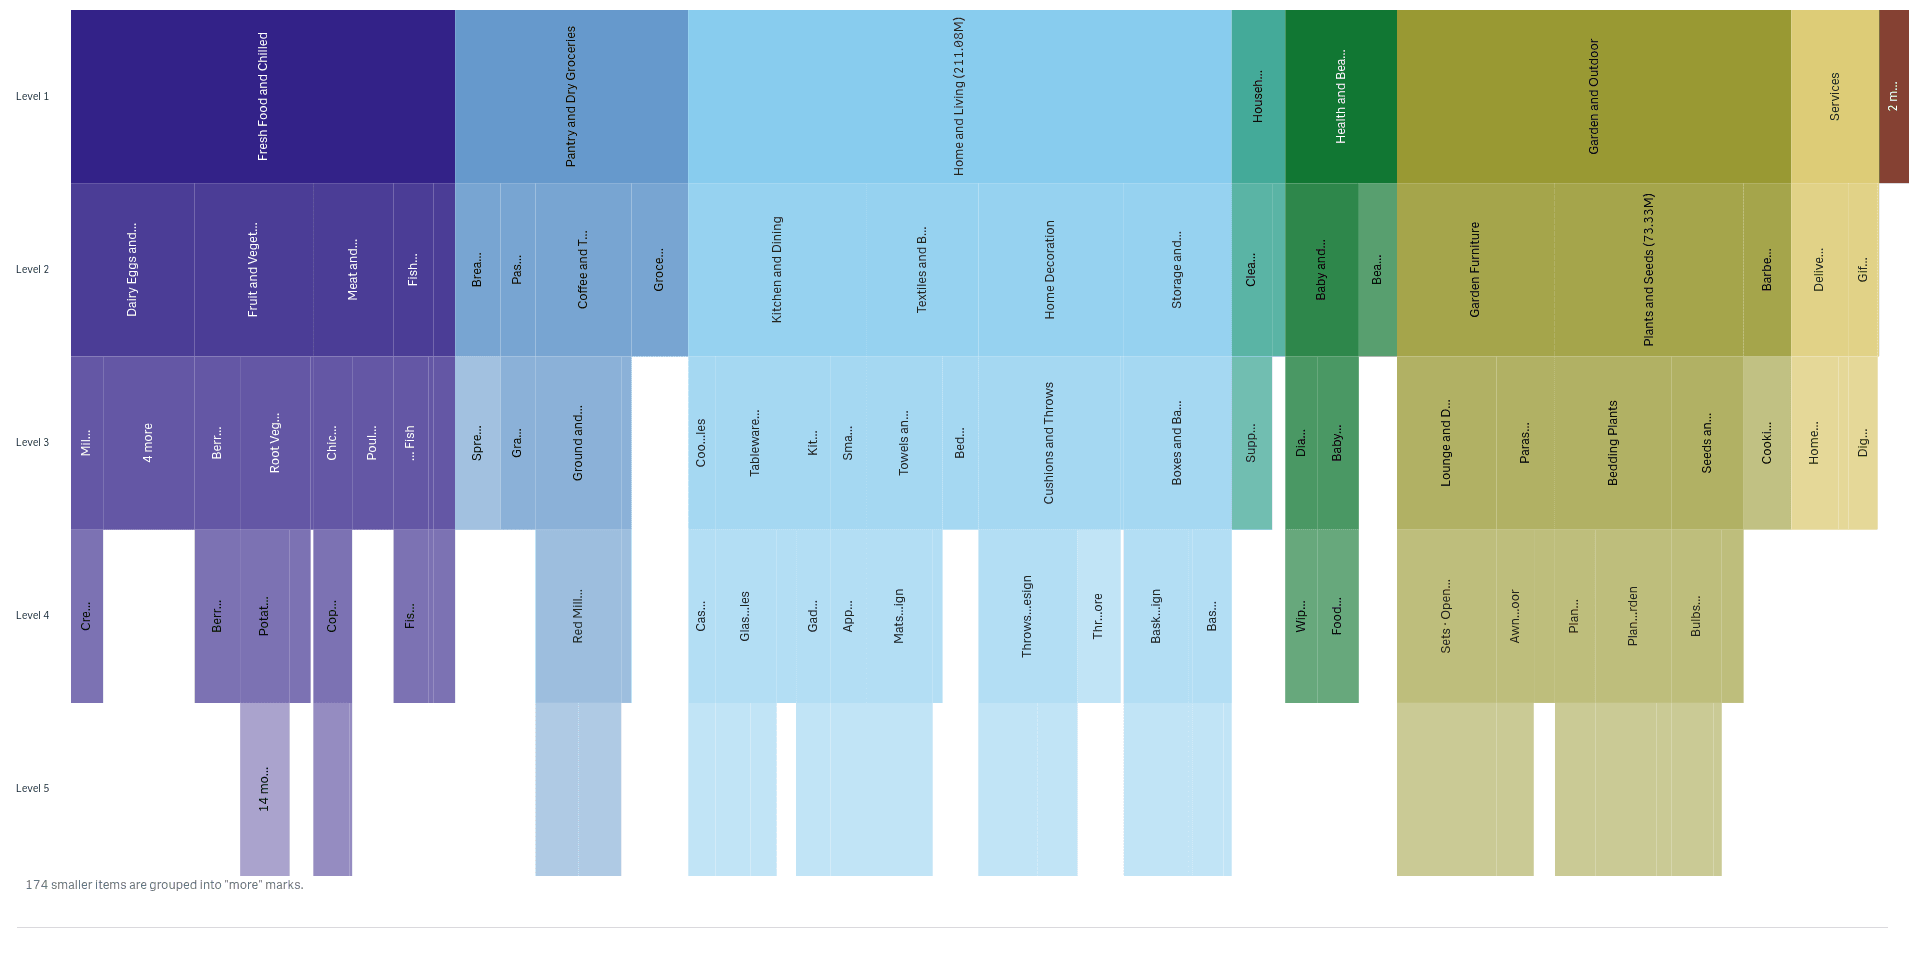
Sunbursts, icicles and trees show how a total splits into categories and sub-categories.
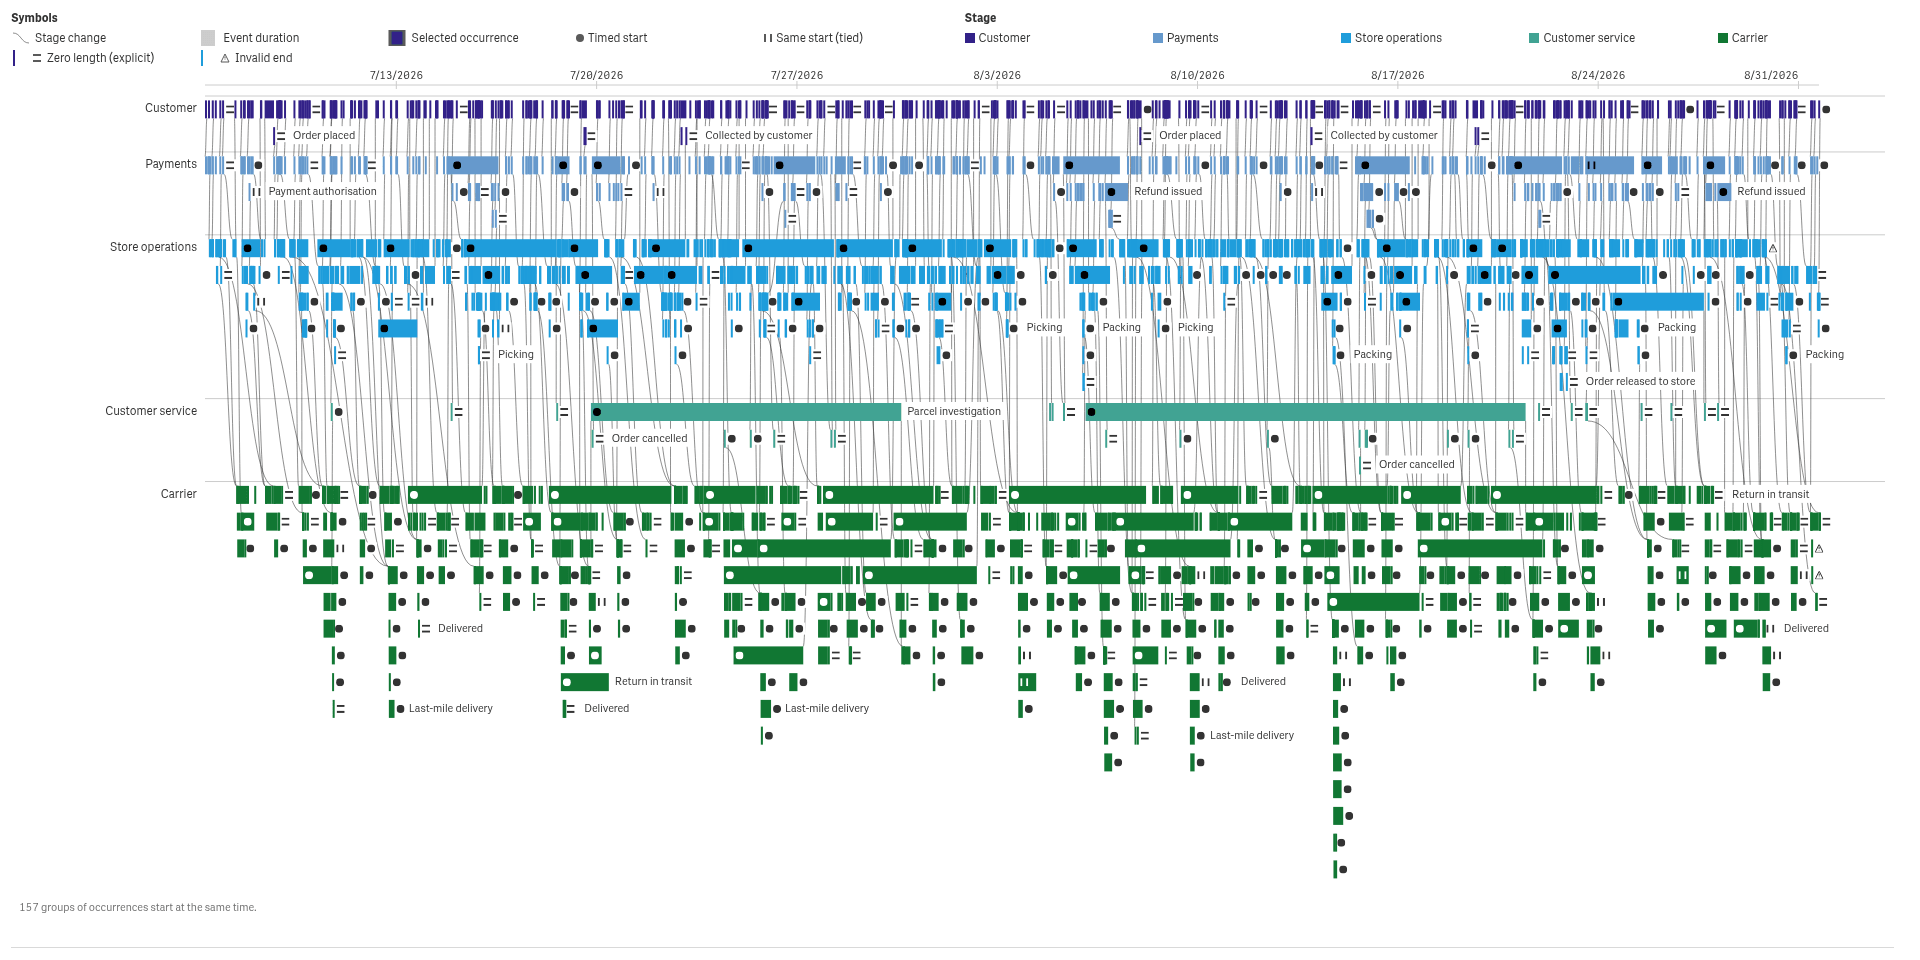
Walk through a process
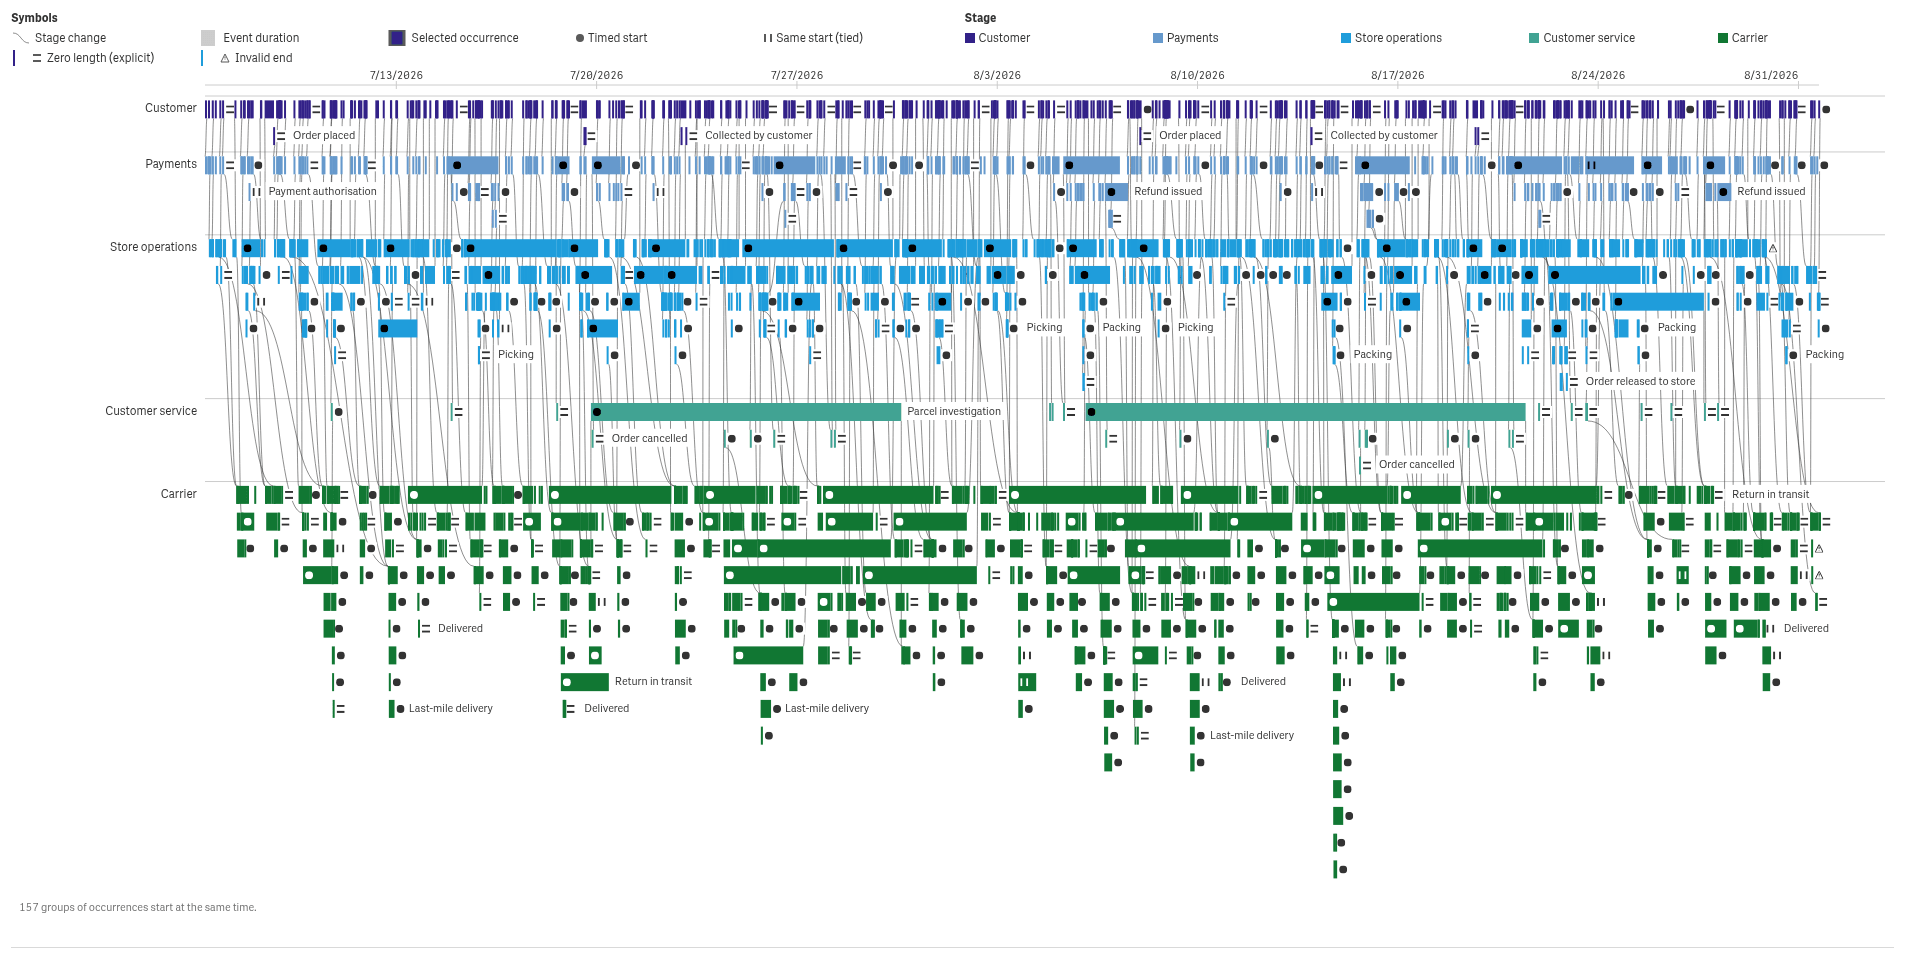
Traces, swimlanes and journeys show how cases move through steps, and where they wait.
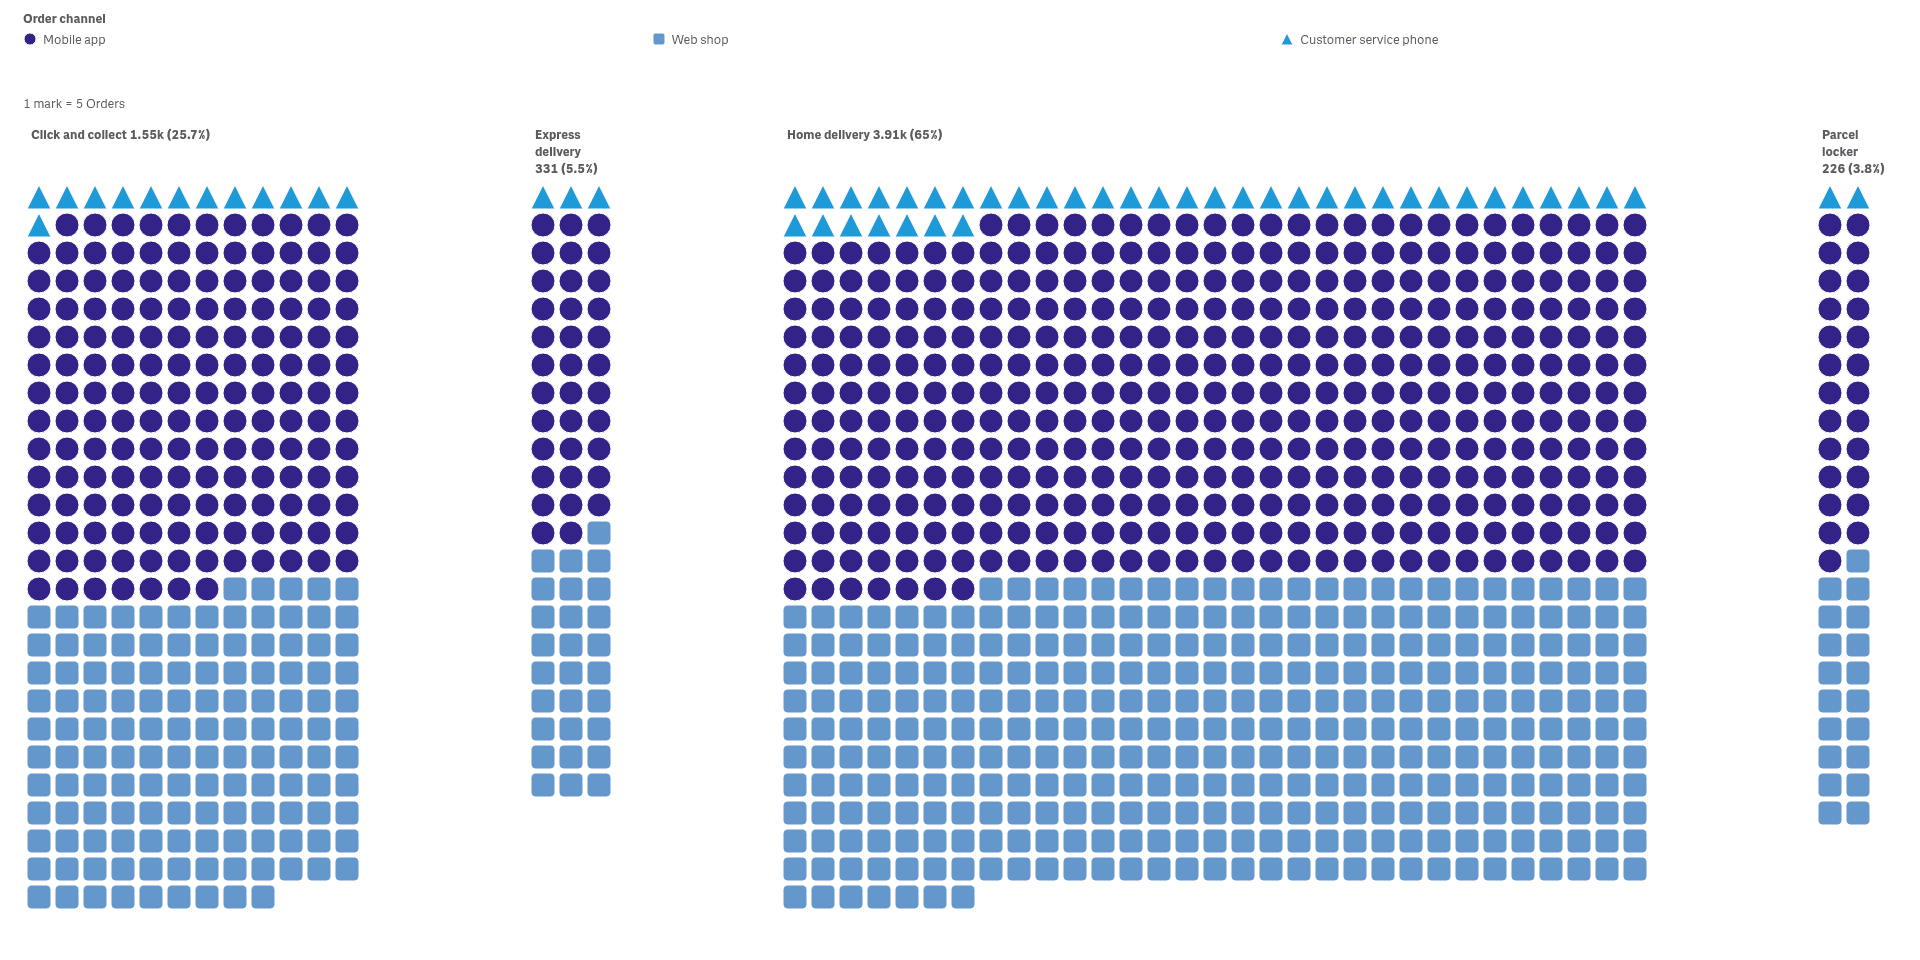
Show the parts of a whole
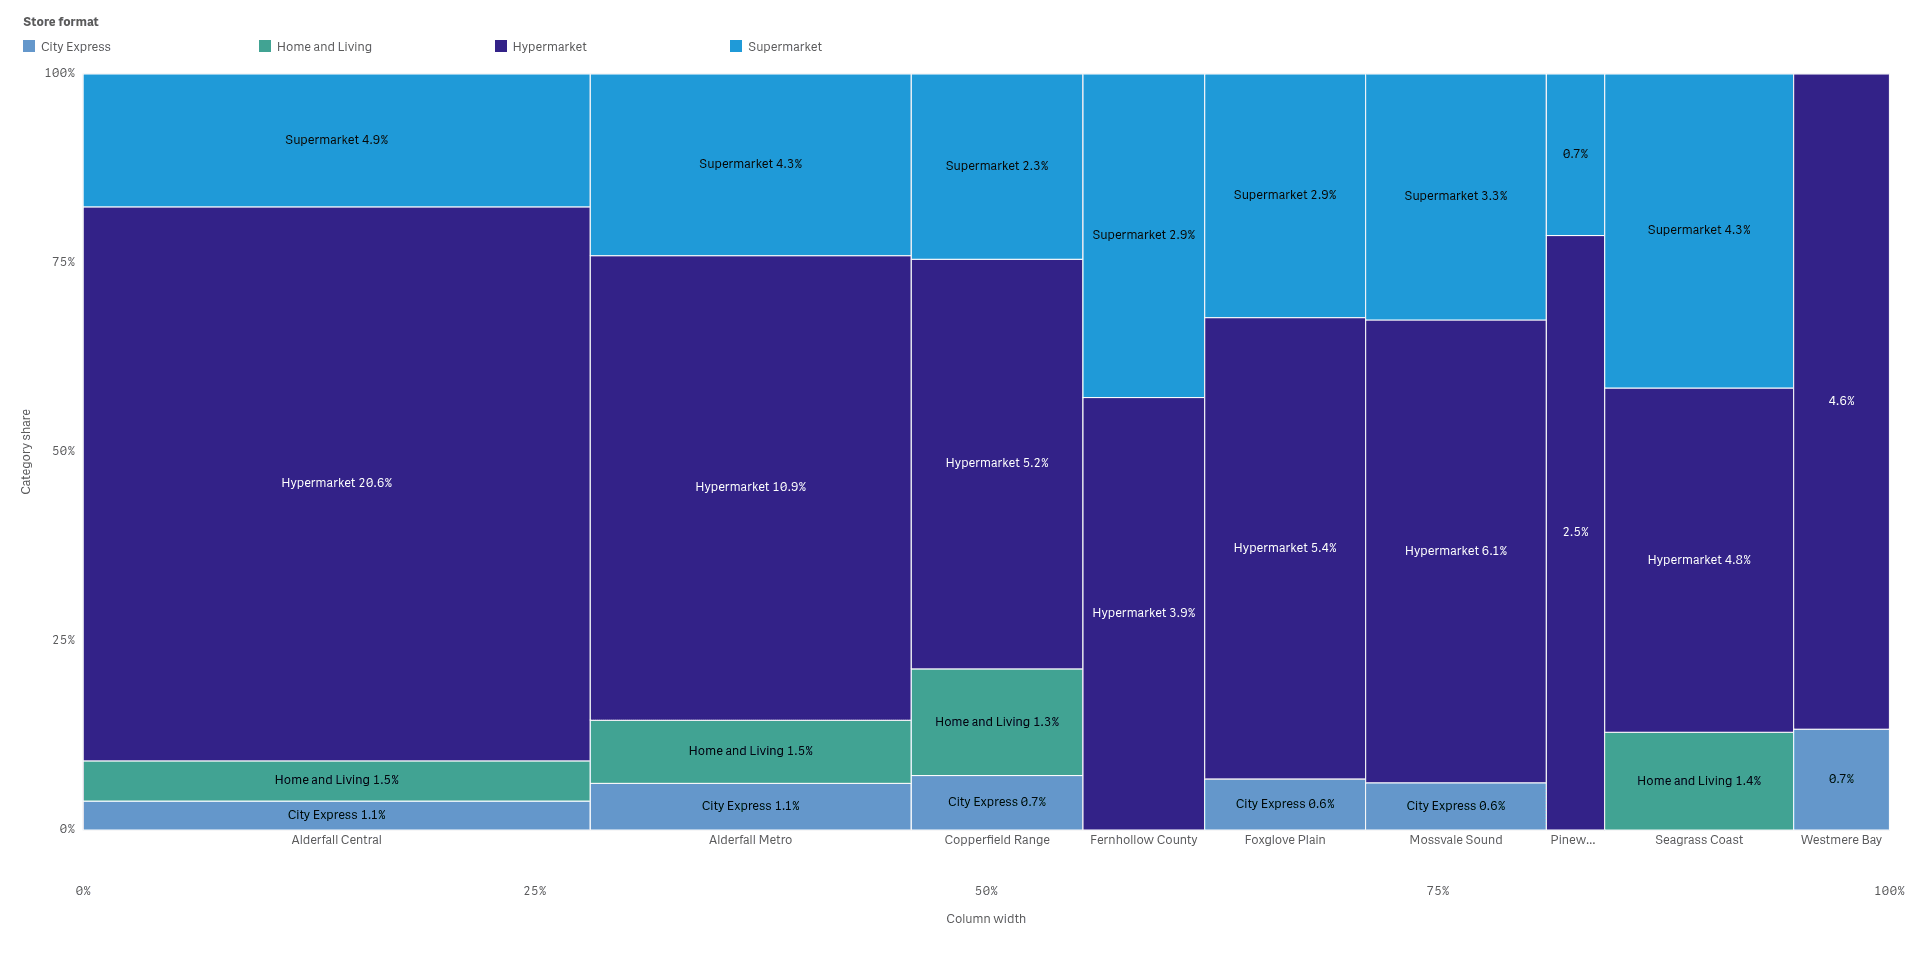
Waffles, unit charts and mosaics show how a total splits into parts, and how the mix differs by group.
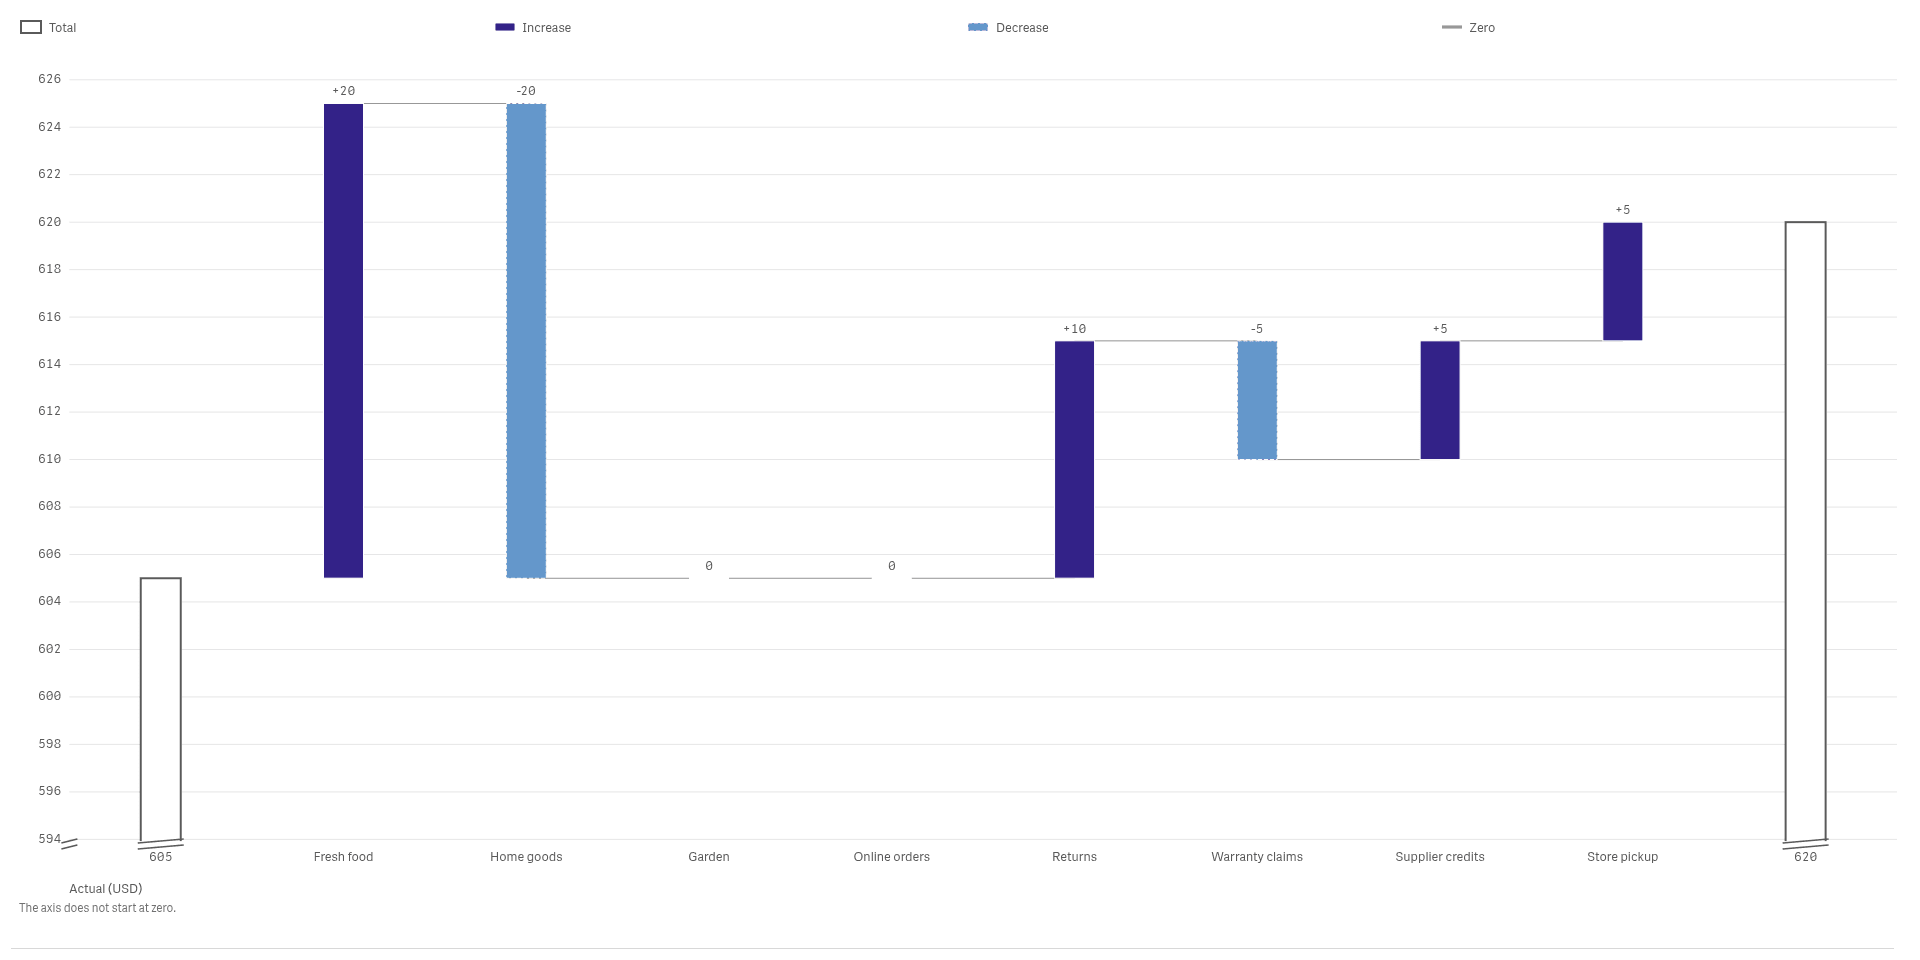
Check actual against plan and target
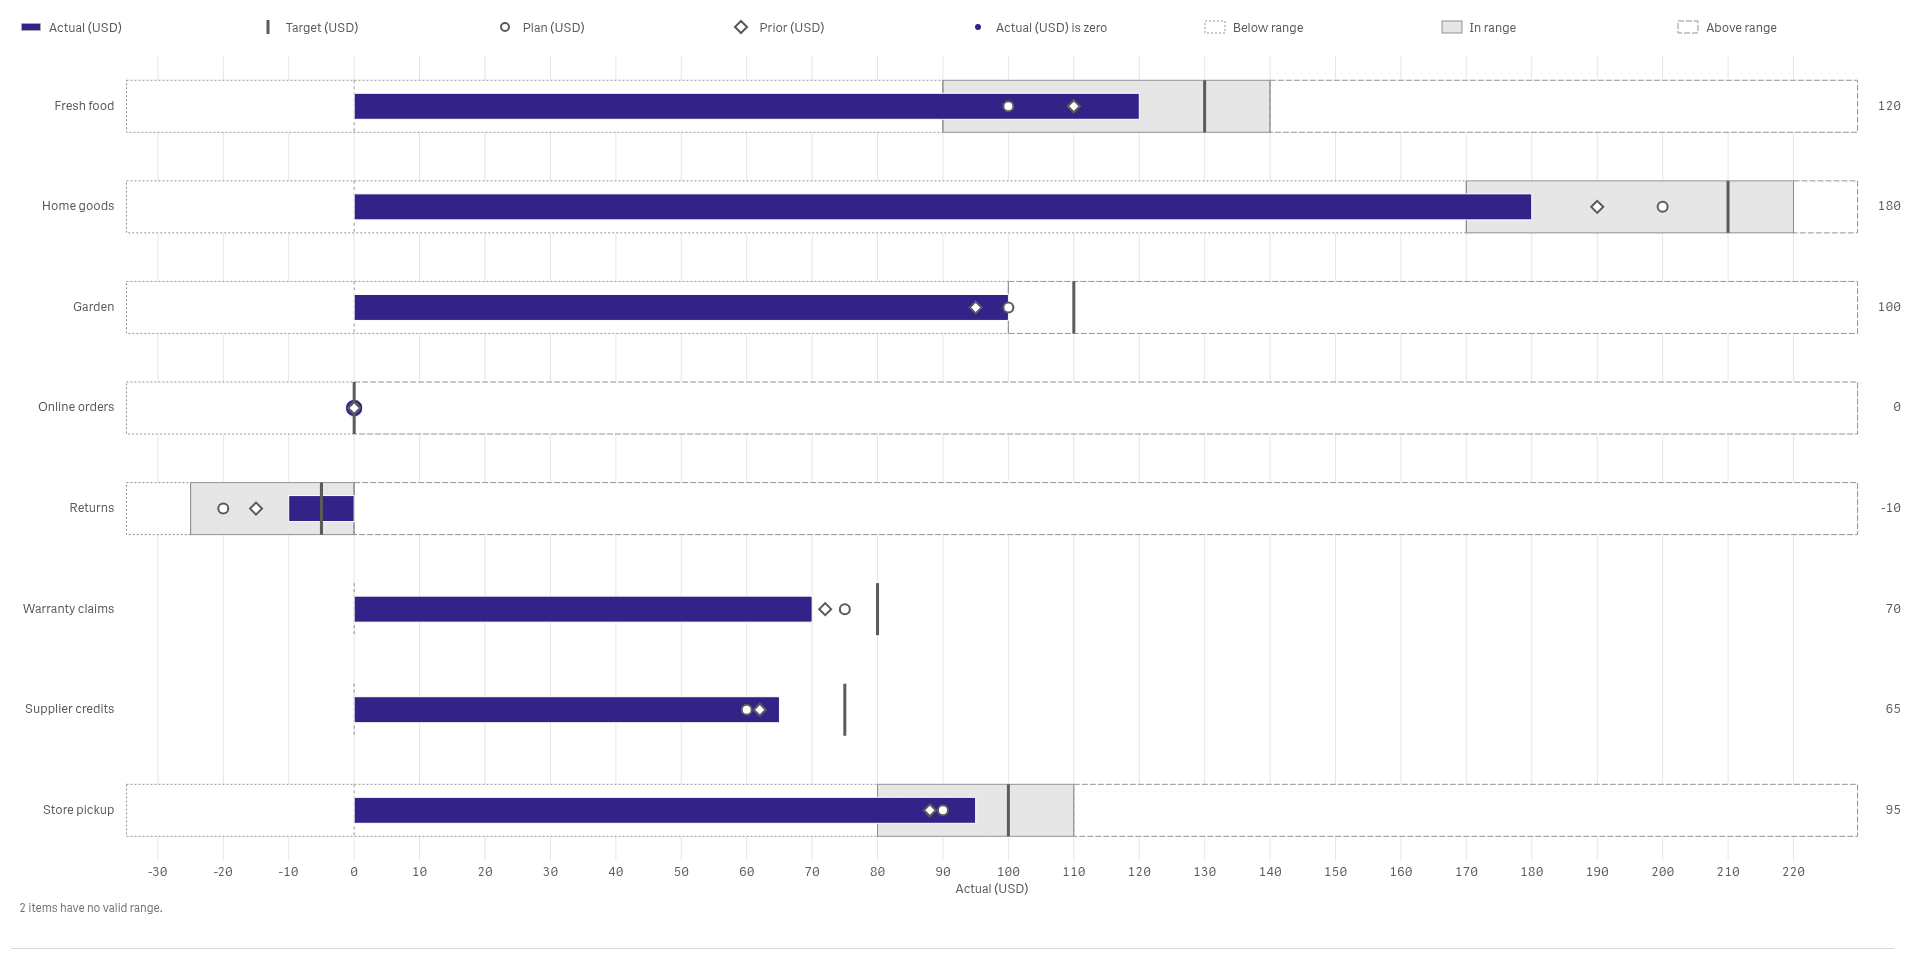
Bullets, waterfalls and pace charts show who is ahead of plan, who is behind and by how much.
See it working
 View full size
 View full size
 View full size
Tm Visualization Suite: Temporal Patterns
See daily rhythm, seasons and trends in one view, and spot the days that break the pattern.
 View full size
Tm Visualization Suite: Distribution Explorer
See the full spread of your values, not just the average, and find the groups that behave differently.
 View full size
Tm Visualization Suite: Comparison Charts
Compare categories, ranges and ranks in one view, and see who moved and by how much.
 View full size
Tm Visualization Suite: Relationship Explorer
See how suppliers, sites and customers connect, and which links carry the most volume.
 View full size
Tm Visualization Suite: Hierarchy Explorer
See how a total splits into categories and sub-categories, and which branches carry the weight.
 View full size
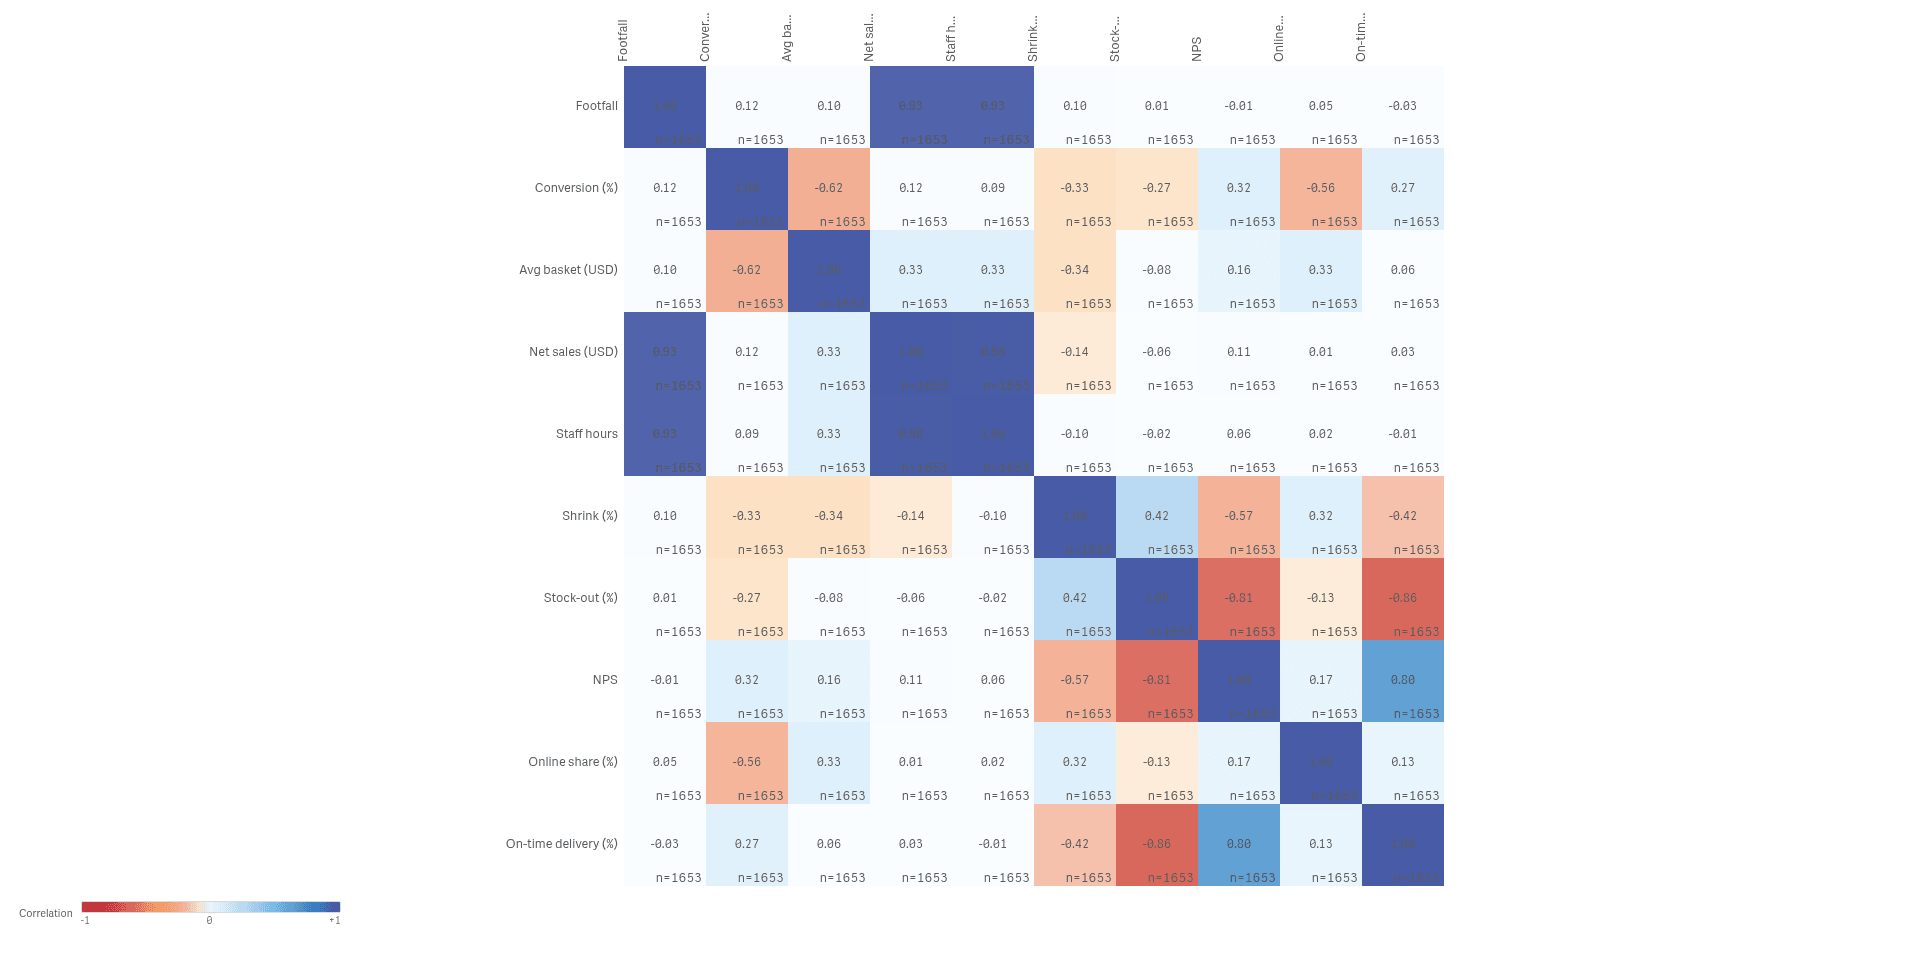
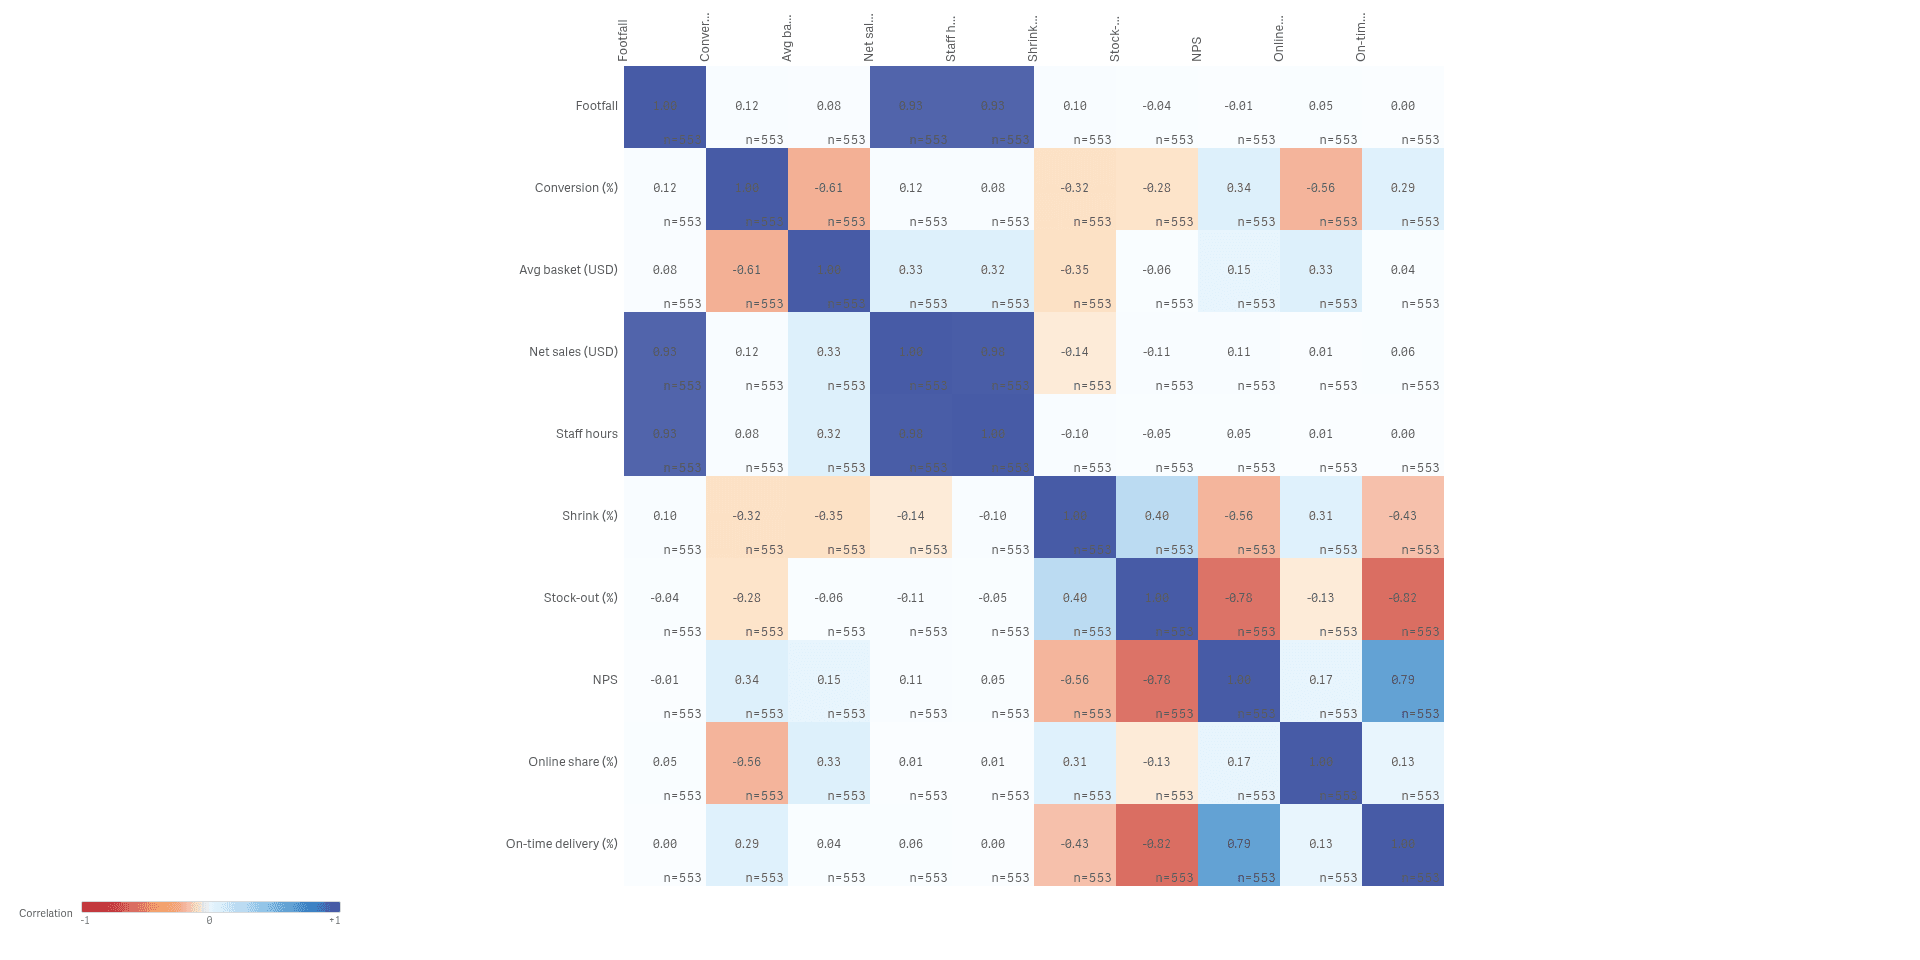
Tm Visualization Suite: Multivariate Explorer
Compare many measures across hundreds of stores at once, and find the ones that behave differently.
 View full size
Tm Visualization Suite: Process Explorer
Follow every order through its steps, and see where it waits, loops or takes a detour.
 View full size
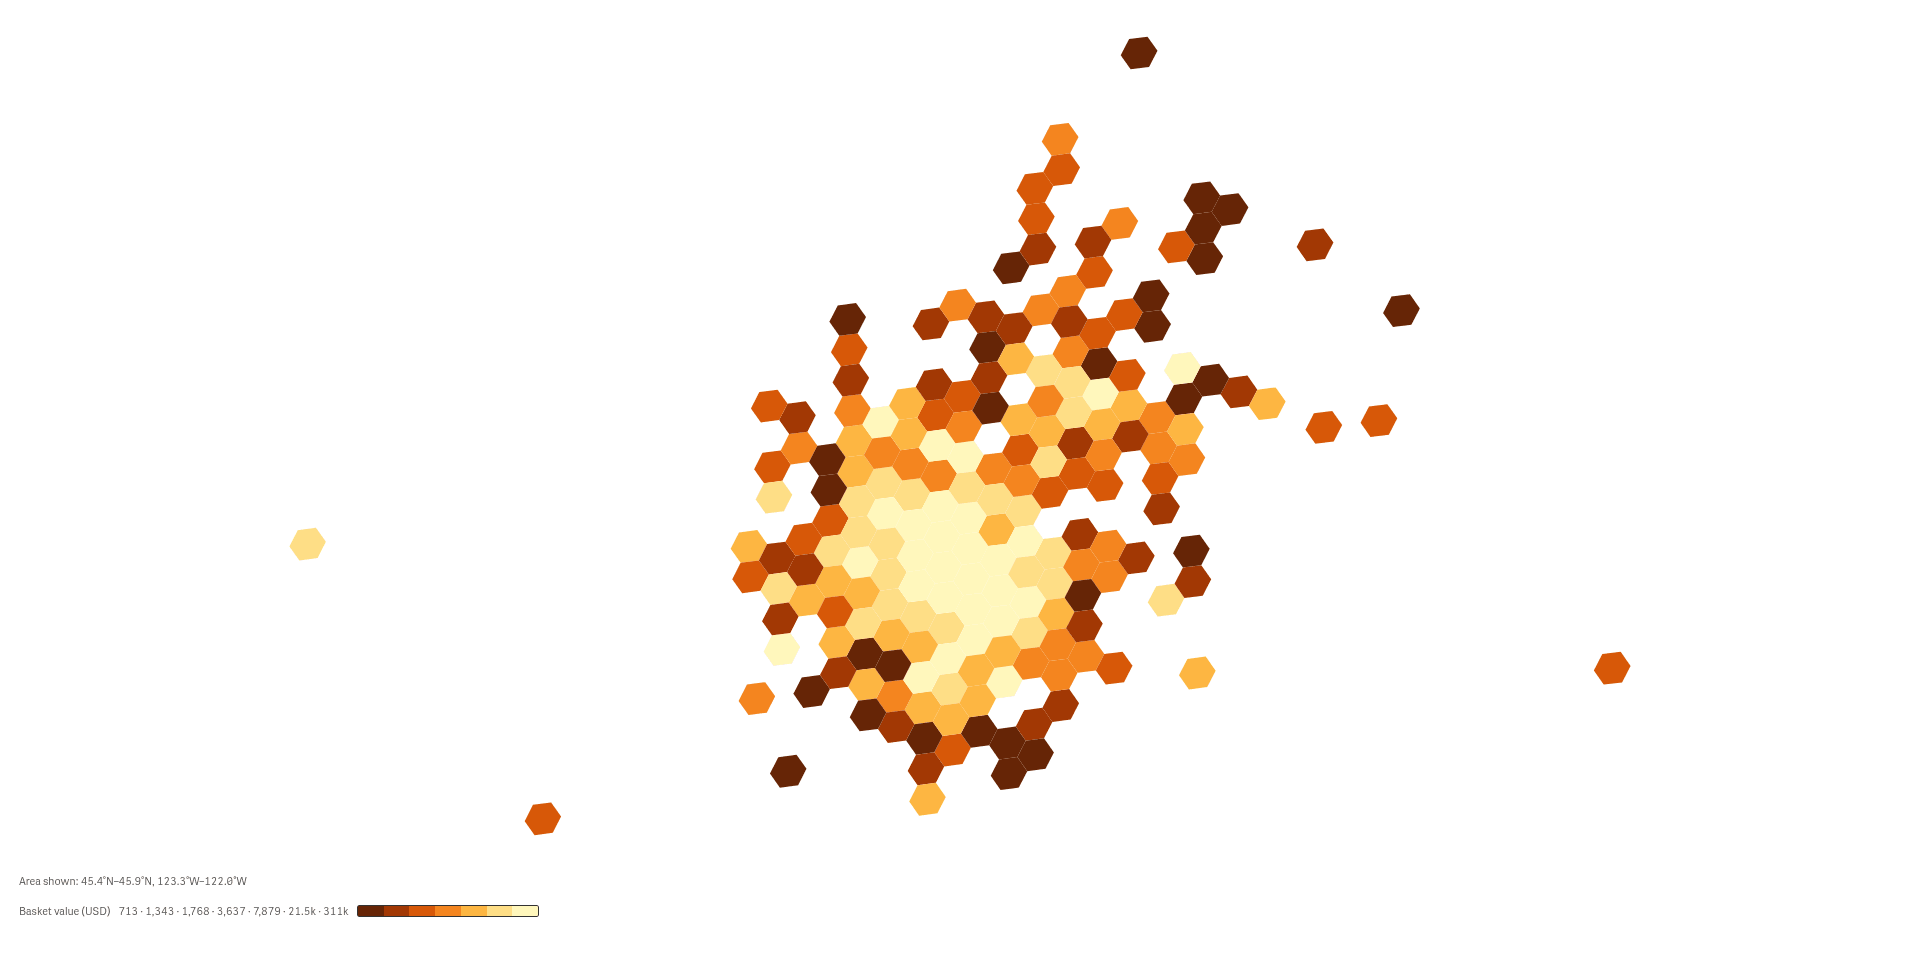
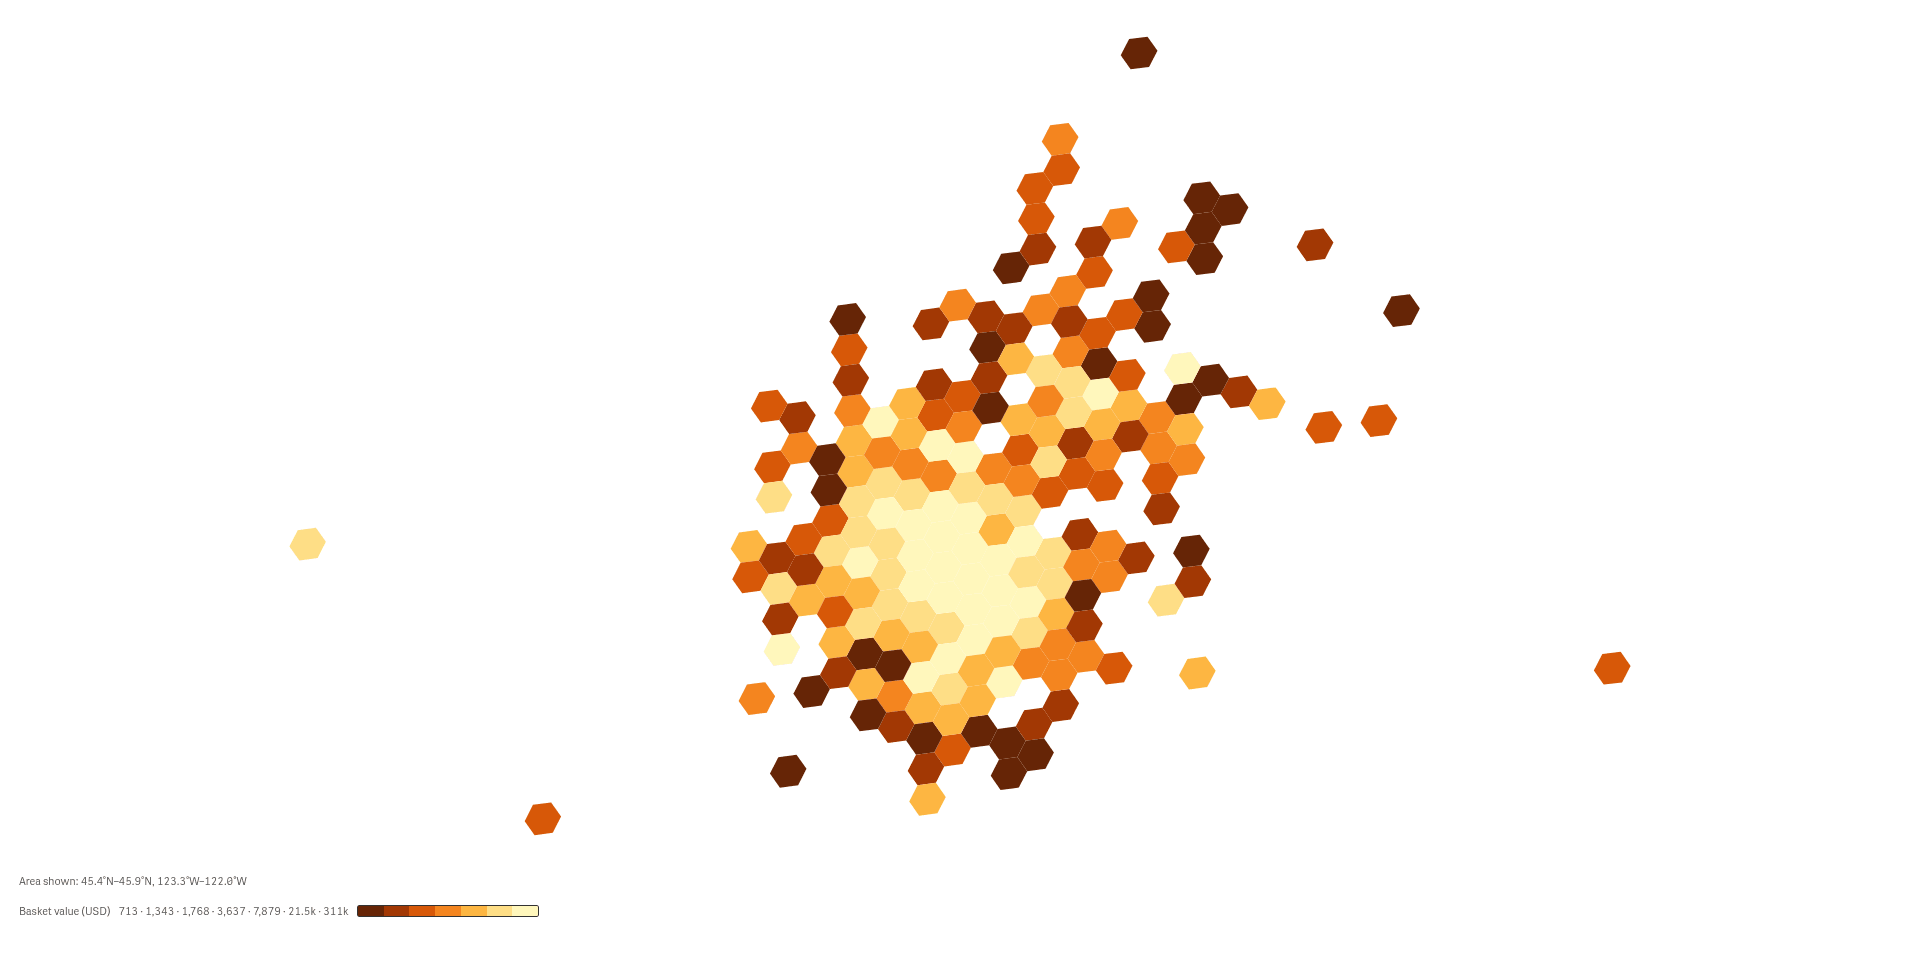
Tm Visualization Suite: Spatial Explorer
See where orders and activity cluster on a map, from a regional overview down to single locations.
 View full size
Tm Visualization Suite: Variance & Targets
Compare actual to plan and target for every item, and see who is ahead, who is behind and by how much.
 View full size
Tm Visualization Suite: Composition
Show how a total splits into parts, and how the mix differs from group to group.
 View full size
Try it
Install
Install an extension in Qlik Cloud or client-managed Qlik Sense.
Family install notes
Install the Tm Licensing carrier extension on Qlik Cloud before you add a family.
- In Administration, open Extensions, then Add.
- Install the carrier zip. Keep the extension file name unchanged.
- Install each family zip from the same Extensions page.
- Reload the open Qlik pages.
One carrier serves every family. The families read it when a sheet opens, and the check is offline. Do not add Tm Licensing to a sheet.
How to get a license
- Review the Product Listing and its documentation.
- E-mail us the Product name, the name of your Qlik Cloud tenant and the number of users.
- We reply to you with the next step.